Quick start for Visium HD spatial datasets with Seurat
Compiled: March 25, 2024
Source:vignettes/visiumHD_commands_intro.Rmd
visiumHD_commands_intro.RmdVisium HD support in Seurat
We have previously released support Seurat for sequencing-based spatial transcriptomic (ST) technologies, including 10x visium and SLIDE-seq. We have now updated Seurat to be compatible with the Visium HD technology, which performs profiling at substantially higher spatial resolution than previous versions.
Users can install the Visium HD-compatible release from Github. Existing Seurat workflows for clustering, visualization, and downstream analysis have been updated to support both Visium and Visium HD data.
We note that Visium HD data is generated from spatially patterned olignocleotides labeled in 2um x 2um bins. However, since the data from this resolution is sparse, adjacent bins are pooled together to create 8um and 16um resolutions. 10x recommends the use of 8um binned data for analysis, but Seurat supports in the simultaneous loading of multiple binnings - and stores them in a single object as multiple assays.
In the brief vignette below we demonstrate how the standard Seurat workflows can be applied to a Visium HD dataset of the mouse intestine, which can be downloaded here. We demonstrate how users can analyze and visualize data at multiple resolutions, and switch between the results.
We are finalizing a full vignette with tailored analytical strategies for high-resolution ST datasets, as well as a formal CRAN release, and look forward to sharing these soon.
Install Seurat update
# packages required for Visium HD
install.packages("hdf5r")
install.packages("arrow")

remotes::install_github(repo = "satijalab/seurat", ref = "visium-hd")Load Visium HD data
- Visium HD mouse small intestine dataset is available for download here
-
bin.sizeparameter specifies resolutions to load (8 and 16um are loaded by default)
# alter localdir to the path where you have saved the outs folder of the demo data
localdir <- "/brahms/lis/visium_hd/Visium_HD_Public_Data/HD_public_data/Visium_HD_Mouse_Small_Intestine/outs"
object <- Load10X_Spatial(data.dir = localdir, bin.size = c(8, 16))
Standard QC (8um)
vln.plot <- VlnPlot(object, features = "nCount_Spatial.008um", pt.size = 0) + NoLegend()
count.plot <- SpatialFeaturePlot(object, features = "nCount_Spatial.008um", pt.size.factor = 1.2) +
    theme(legend.position = "right")
vln.plot | count.plot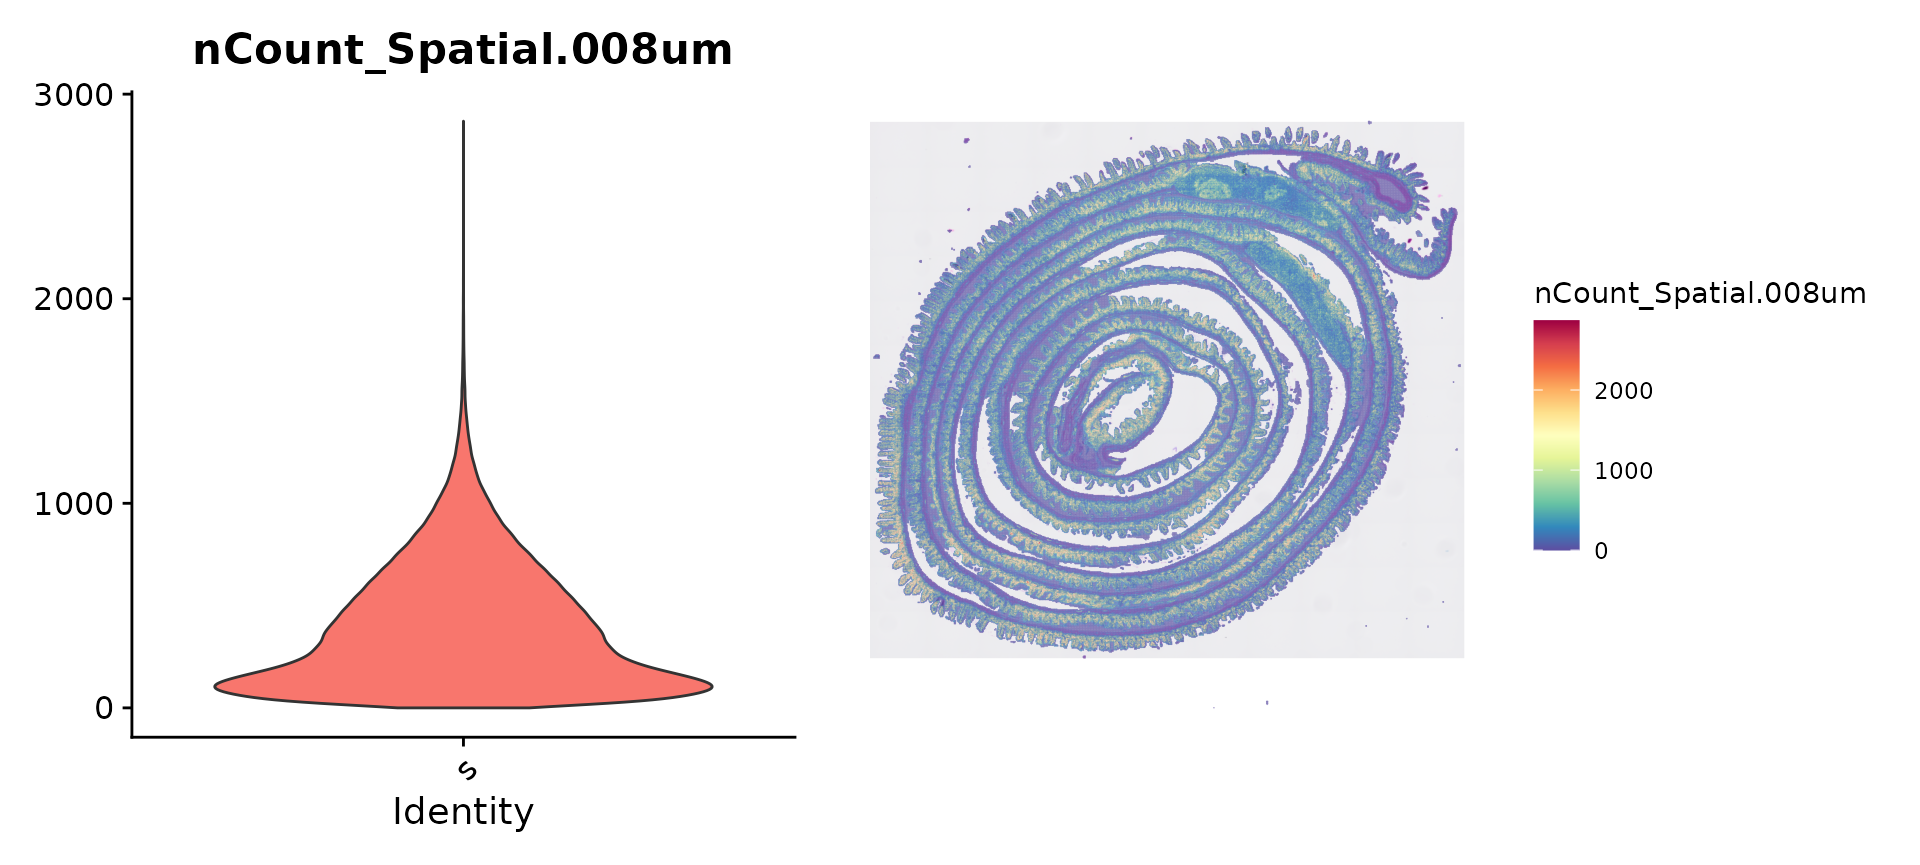
Normalize datasets
# SCTransform also supported, but we use LogNormalize here
DefaultAssay(object) <- "Spatial.008um"
object <- NormalizeData(object)

DefaultAssay(object) <- "Spatial.016um"
object <- NormalizeData(object)
Visualize gene expression
- Setting
pt.size.factorto 1.2 helps to visualize molecular and histological info in this HD dataset
- You can also adjust the
shape, andstroke(outline) parameters for visualization
# spatial resolution previously set at 16um
p1 <- SpatialFeaturePlot(object, features = "Ighm", pt.size.factor = 1.2) + ggtitle("Ighm expression (16um)")

# switch spatial resolution
DefaultAssay(object) <- "Spatial.008um"
p2 <- SpatialFeaturePlot(object, features = "Jchain", pt.size.factor = 1.2) + ggtitle("Jchain expression (8um)")
p1 | p2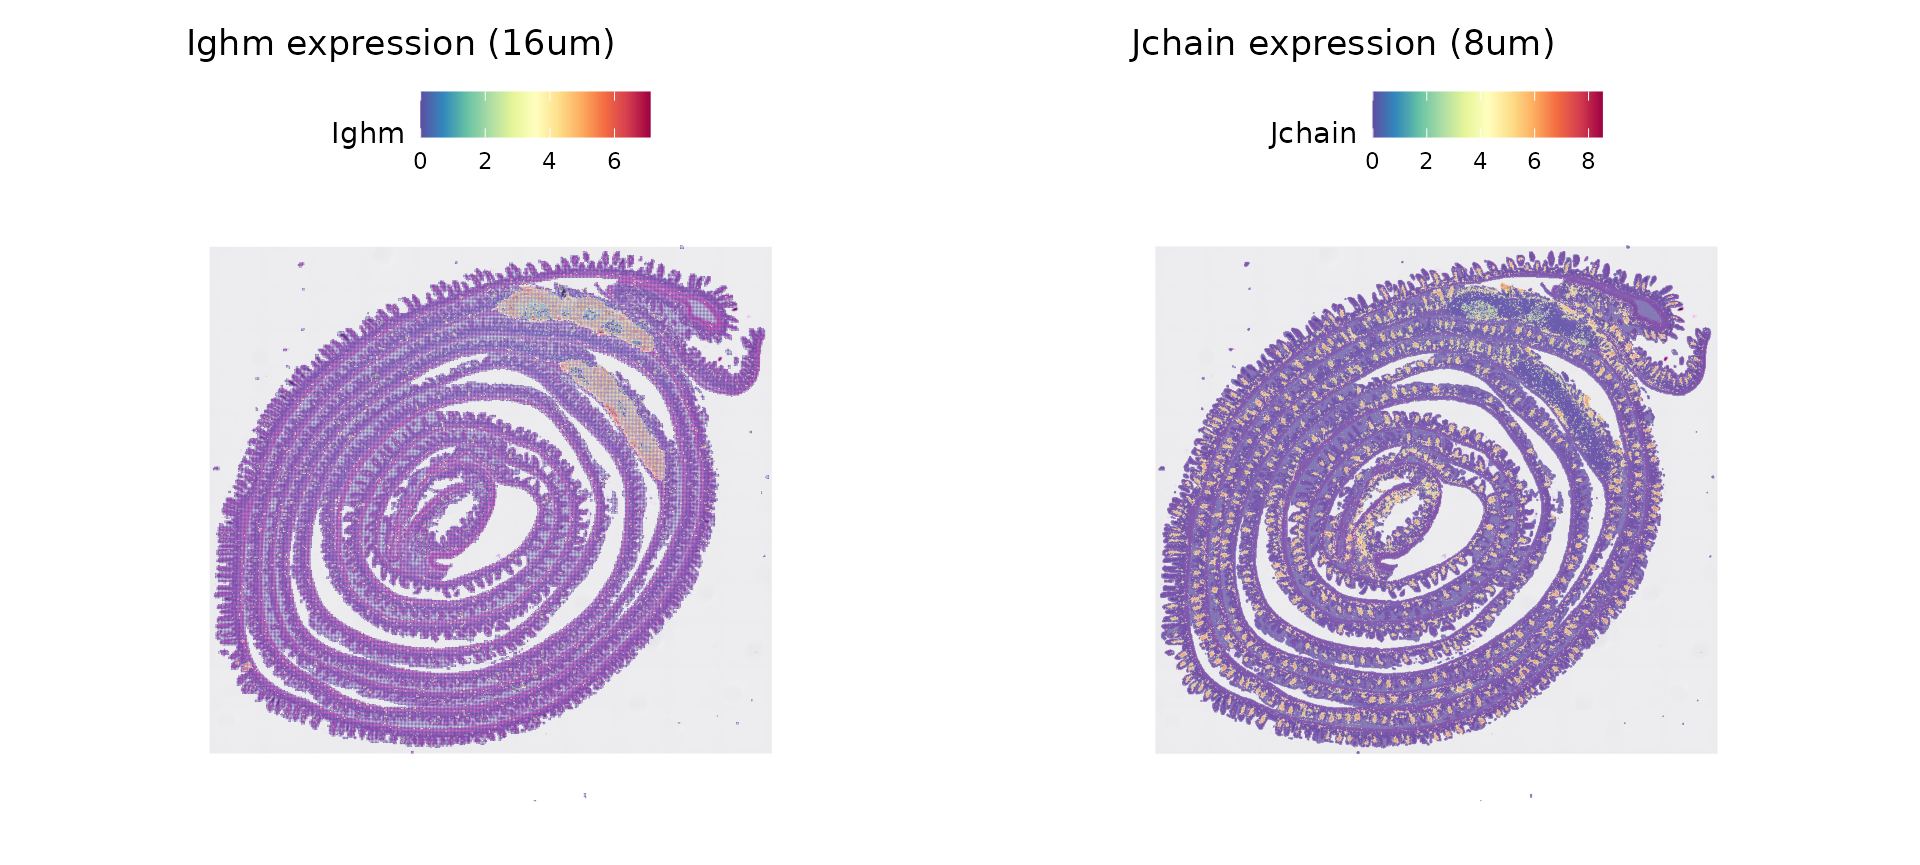
Standard processing workflow
# can use Spatial.016um to analyze 16um binning as well
DefaultAssay(object) <- "Spatial.008um"

# note that data has already been normalized
object <- FindVariableFeatures(object)
object <- ScaleData(object)
object <- RunPCA(object, reduction.name = "pca.008um")
object <- FindNeighbors(object, reduction = "pca.008um", dims = 1:30)
object <- FindClusters(object, resolution = 0.6, cluster.name = "seurat_cluster.008um")
## Modularity Optimizer version 1.3.0 by Ludo Waltman and Nees Jan van Eck
##
## Number of nodes: 351817
## Number of edges: 9488608
##
## Running Louvain algorithm...
## Maximum modularity in 10 random starts: 0.9029
## Number of communities: 36
## Elapsed time: 358 seconds
object <- RunUMAP(object, reduction = "pca.008um", reduction.name = "umap.008um", dims = 1:30)
dim.plot <- DimPlot(object, reduction = "umap.008um", group.by = "seurat_cluster.008um", label = TRUE,
    repel = T) + NoLegend()
cluster.plot <- SpatialDimPlot(object, group.by = "seurat_cluster.008um", label = FALSE, pt.size.factor = 1.2) +
    theme(legend.position = "right")
dim.plot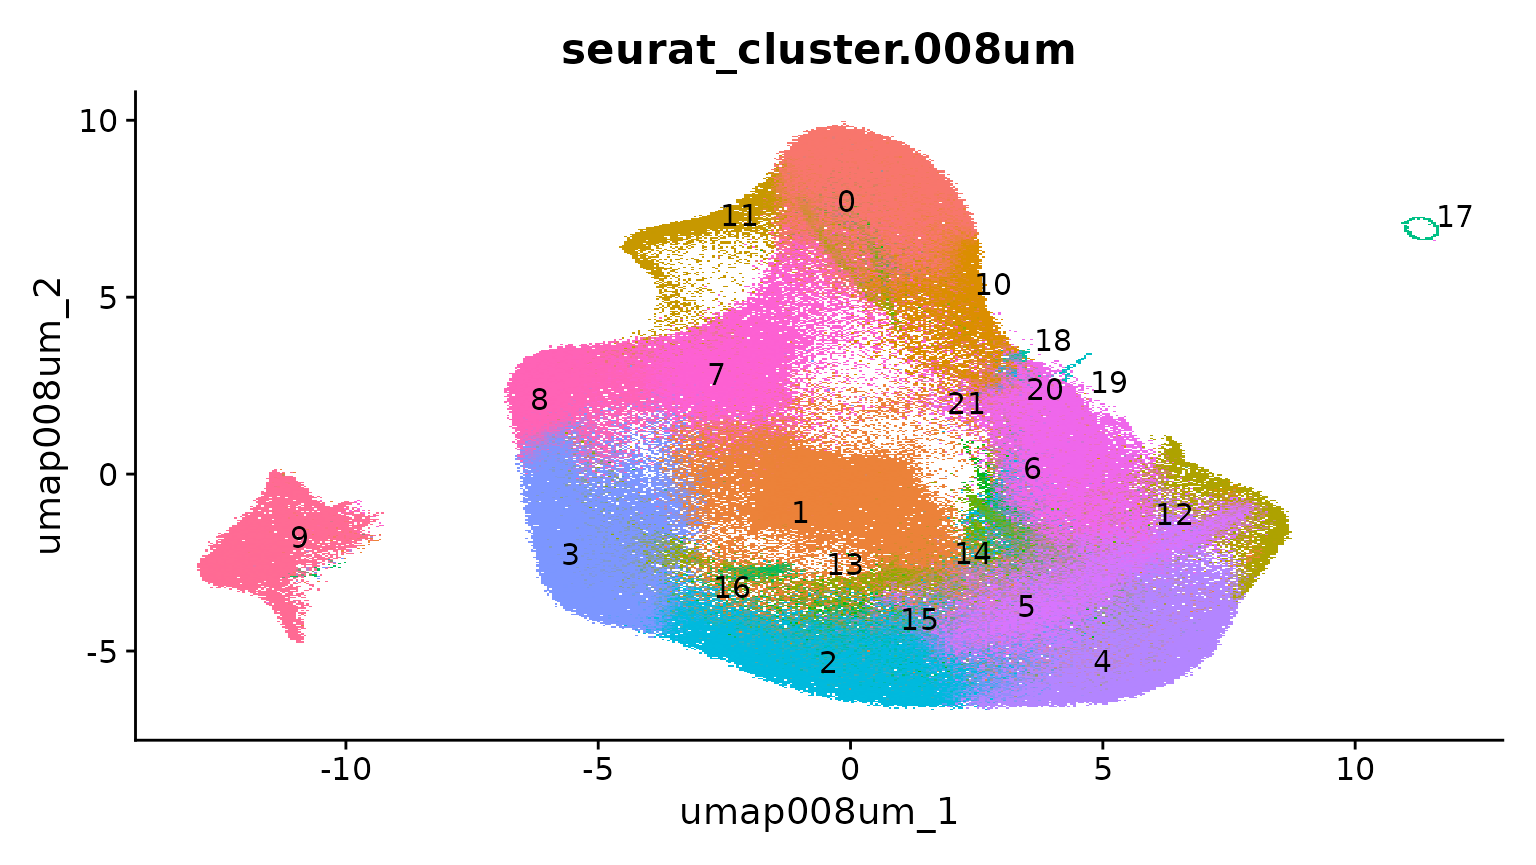
cluster.plot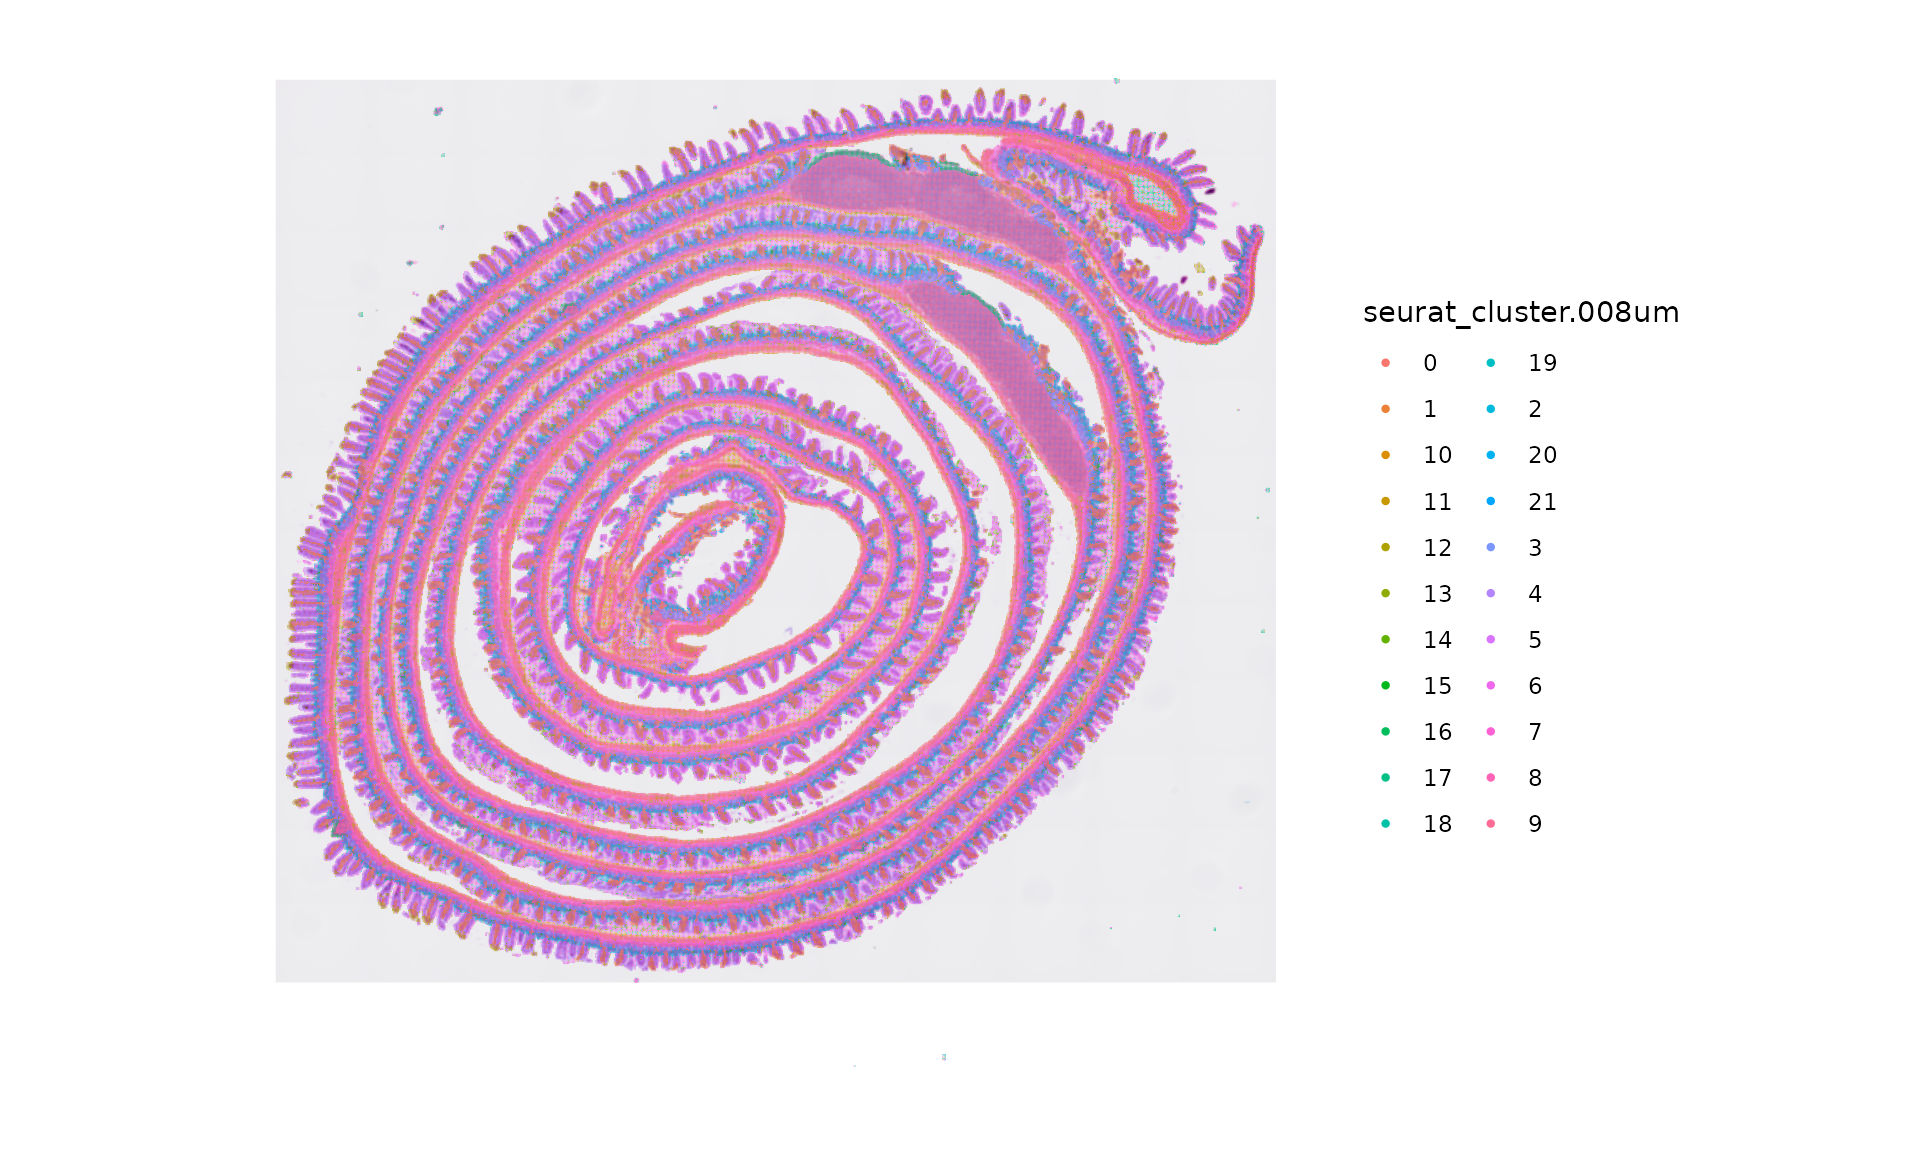
# can highlight by identity for more detailed visualization
p5 <- SpatialDimPlot(object, cells.highlight = WhichCells(object, expression = seurat_cluster.008um ==
    0), pt.size.factor = 1.2) + NoLegend() + ggtitle("Cluster 0")
p6 <- SpatialDimPlot(object, cells.highlight = WhichCells(object, expression = seurat_cluster.008um ==
    1), pt.size.factor = 1.2) + NoLegend() + ggtitle("Cluster 1")
p5 | p6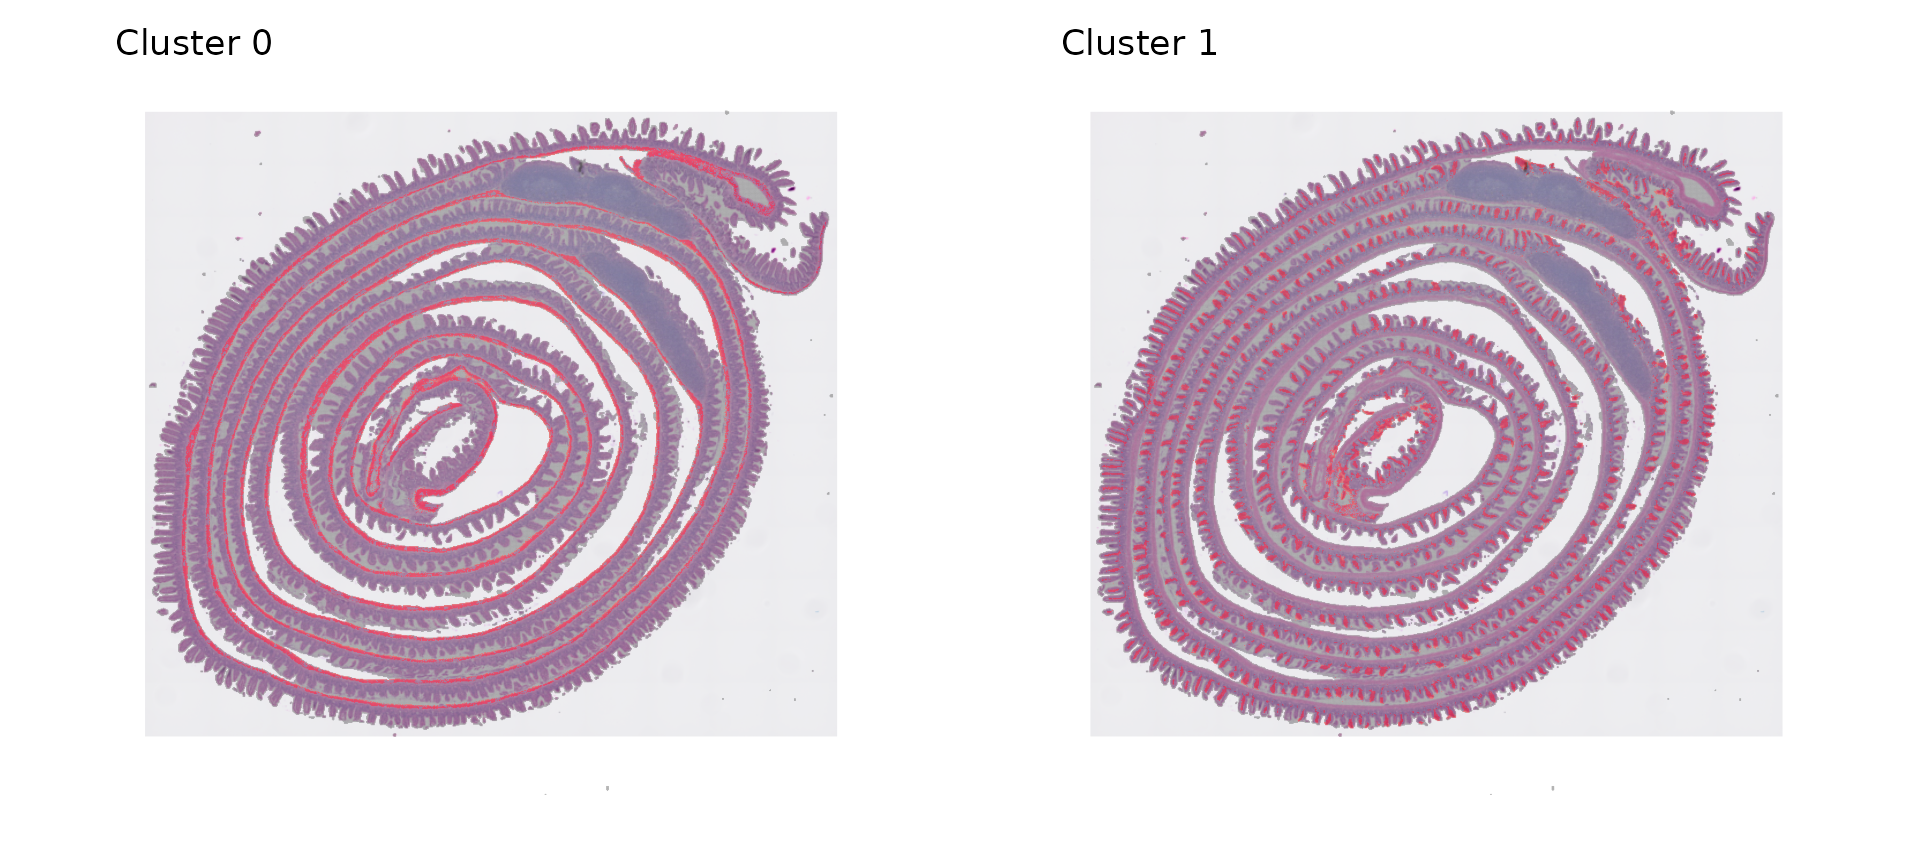
Session Info
## R version 4.2.2 Patched (2022-11-10 r83330)
## Platform: x86_64-pc-linux-gnu (64-bit)
## Running under: Ubuntu 20.04.6 LTS
##
## Matrix products: default
## BLAS:   /usr/lib/x86_64-linux-gnu/blas/libblas.so.3.9.0
## LAPACK: /usr/lib/x86_64-linux-gnu/lapack/liblapack.so.3.9.0
##
## locale:
##  [1] LC_CTYPE=en_US.UTF-8       LC_NUMERIC=C
##  [3] LC_TIME=en_US.UTF-8        LC_COLLATE=en_US.UTF-8
##  [5] LC_MONETARY=en_US.UTF-8    LC_MESSAGES=en_US.UTF-8
##  [7] LC_PAPER=en_US.UTF-8       LC_NAME=C
##  [9] LC_ADDRESS=C               LC_TELEPHONE=C
## [11] LC_MEASUREMENT=en_US.UTF-8 LC_IDENTIFICATION=C
##
## attached base packages:
## [1] stats     graphics  grDevices utils     datasets  methods   base
##
## other attached packages:
## [1] dplyr_1.1.4             patchwork_1.2.0         ggplot2_3.5.0
## [4] Seurat_5.0.3.9909       SeuratObject_5.0.1.9006 sp_2.1-3
##
## loaded via a namespace (and not attached):
##   [1] spam_2.10-0            systemfonts_1.0.5      plyr_1.8.9
##   [4] igraph_2.0.3           lazyeval_0.2.2         splines_4.2.2
##   [7] RcppHNSW_0.6.0         listenv_0.9.1          scattermore_1.2
##  [10] digest_0.6.35          htmltools_0.5.7        fansi_1.0.6
##  [13] magrittr_2.0.3         memoise_2.0.1          tensor_1.5
##  [16] cluster_2.1.6          ROCR_1.0-11            remotes_2.5.0
##  [19] globals_0.16.3         matrixStats_1.2.0      pkgdown_2.0.7
##  [22] spatstat.sparse_3.0-3  prettyunits_1.2.0      colorspace_2.1-0
##  [25] ggrepel_0.9.5          textshaping_0.3.7      xfun_0.43
##  [28] callr_3.7.3            crayon_1.5.2           jsonlite_1.8.8
##  [31] progressr_0.14.0       spatstat.data_3.0-4    survival_3.5-7
##  [34] zoo_1.8-12             glue_1.7.0             polyclip_1.10-6
##  [37] gtable_0.3.4           leiden_0.4.3.1         pkgbuild_1.4.2
##  [40] future.apply_1.11.1    abind_1.4-5            scales_1.3.0
##  [43] spatstat.random_3.2-3  miniUI_0.1.1.1         Rcpp_1.0.12
##  [46] viridisLite_0.4.2      xtable_1.8-4           reticulate_1.35.0
##  [49] bit_4.0.5              dotCall64_1.1-1        htmlwidgets_1.6.4
##  [52] httr_1.4.7             RColorBrewer_1.1-3     ellipsis_0.3.2
##  [55] ica_1.0-3              farver_2.1.1           pkgconfig_2.0.3
##  [58] sass_0.4.9             uwot_0.1.16            deldir_2.0-4
##  [61] utf8_1.2.4             labeling_0.4.3         tidyselect_1.2.1
##  [64] rlang_1.1.3            reshape2_1.4.4         later_1.3.2
##  [67] munsell_0.5.0          tools_4.2.2            cachem_1.0.8
##  [70] cli_3.6.2              generics_0.1.3         ggridges_0.5.6
##  [73] evaluate_0.23          stringr_1.5.1          fastmap_1.1.1
##  [76] yaml_2.3.8             ragg_1.2.7             goftest_1.2-3
##  [79] processx_3.8.2         knitr_1.45             bit64_4.0.5
##  [82] fs_1.6.3               fitdistrplus_1.1-11    purrr_1.0.2
##  [85] RANN_2.6.1             pbapply_1.7-2          future_1.33.1
##  [88] nlme_3.1-162           mime_0.12              formatR_1.14
##  [91] ggrastr_1.0.2          arrow_15.0.1           hdf5r_1.3.10
##  [94] compiler_4.2.2         beeswarm_0.4.0         plotly_4.10.4
##  [97] curl_5.2.1             png_0.1-8              spatstat.utils_3.0-4
## [100] tibble_3.2.1           bslib_0.6.2            stringi_1.8.3
## [103] highr_0.10             ps_1.7.5               desc_1.4.2
## [106] RSpectra_0.16-1        lattice_0.21-9         Matrix_1.6-5
## [109] vctrs_0.6.5            pillar_1.9.0           lifecycle_1.0.4
## [112] spatstat.geom_3.2-9    lmtest_0.9-40          jquerylib_0.1.4
## [115] RcppAnnoy_0.0.22       data.table_1.15.2      cowplot_1.1.3
## [118] irlba_2.3.5.1          httpuv_1.6.14          R6_2.5.1
## [121] promises_1.2.1         KernSmooth_2.23-22     gridExtra_2.3
## [124] vipor_0.4.5            parallelly_1.37.1      codetools_0.2-19
## [127] assertthat_0.2.1       fastDummies_1.7.3      MASS_7.3-58.2
## [130] rprojroot_2.0.4        withr_3.0.0            sctransform_0.4.1
## [133] parallel_4.2.2         grid_4.2.2             tidyr_1.3.1
## [136] rmarkdown_2.26         Rtsne_0.17             spatstat.explore_3.2-7
## [139] shiny_1.8.0            ggbeeswarm_0.7.2