Various themes to be applied to ggplot2-based plots
SeuratThemeThe curated Seurat theme, consists of ...
DarkThemeA dark theme, axes and text turn to white, the background becomes black
NoAxesRemoves axis lines, text, and ticks
NoLegendRemoves the legend
FontSizeSets axis and title font sizes
NoGridRemoves grid lines
SeuratAxesSet Seurat-style axes
SpatialThemeA theme designed for spatial visualizations (eg
PolyFeaturePlot,PolyDimPlot)RestoreLegendRestore a legend after removal
RotatedAxisRotate X axis text 45 degrees
BoldTitleEnlarges and emphasizes the title
SeuratTheme()

CenterTitle(...)

DarkTheme(...)

FontSize(
  x.text = NULL,
  y.text = NULL,
  x.title = NULL,
  y.title = NULL,
  main = NULL,
  ...
)

NoAxes(..., keep.text = FALSE, keep.ticks = FALSE)

NoLegend(...)

NoGrid(...)

SeuratAxes(...)

SpatialTheme(...)

RestoreLegend(..., position = "right")

RotatedAxis(...)

BoldTitle(...)

WhiteBackground(...)
Arguments
Value
A ggplot2 theme object
See also
Examples
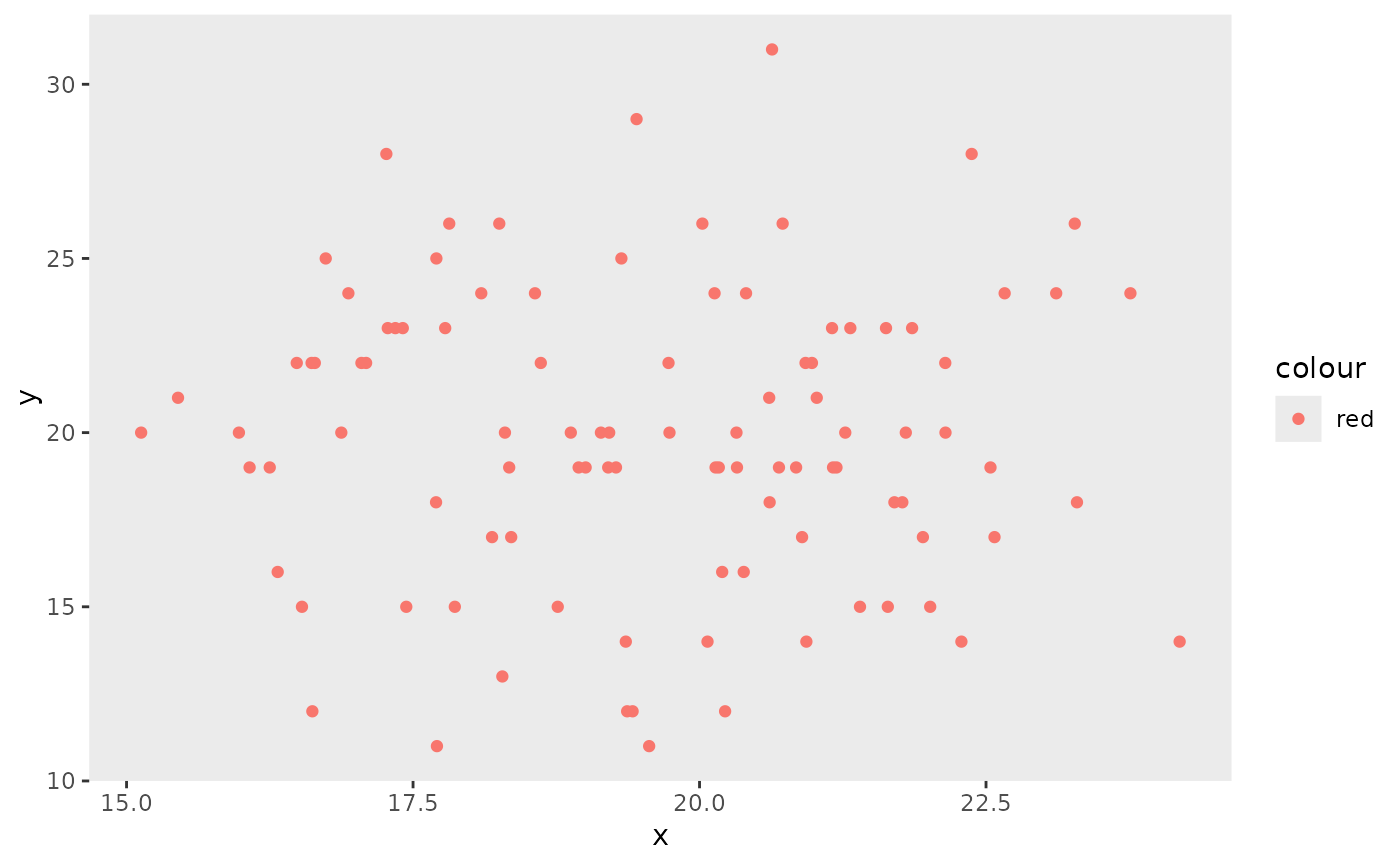
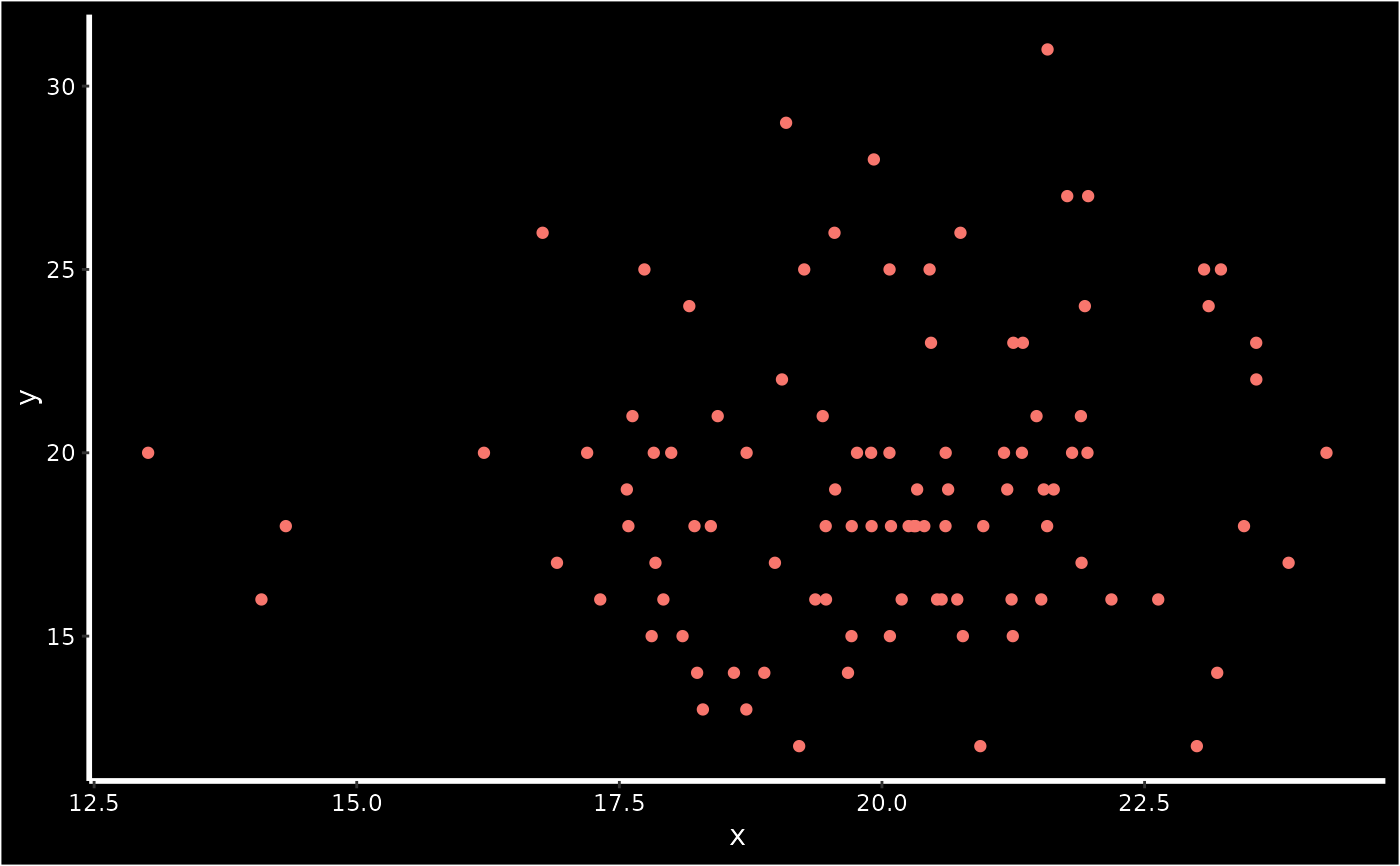
# Generate a plot with a dark theme
library(ggplot2)
df <- data.frame(x = rnorm(n = 100, mean = 20, sd = 2), y = rbinom(n = 100, size = 100, prob = 0.2))
p <- ggplot(data = df, mapping = aes(x = x, y = y)) + geom_point(mapping = aes(color = 'red'))
p + DarkTheme(legend.position = 'none')
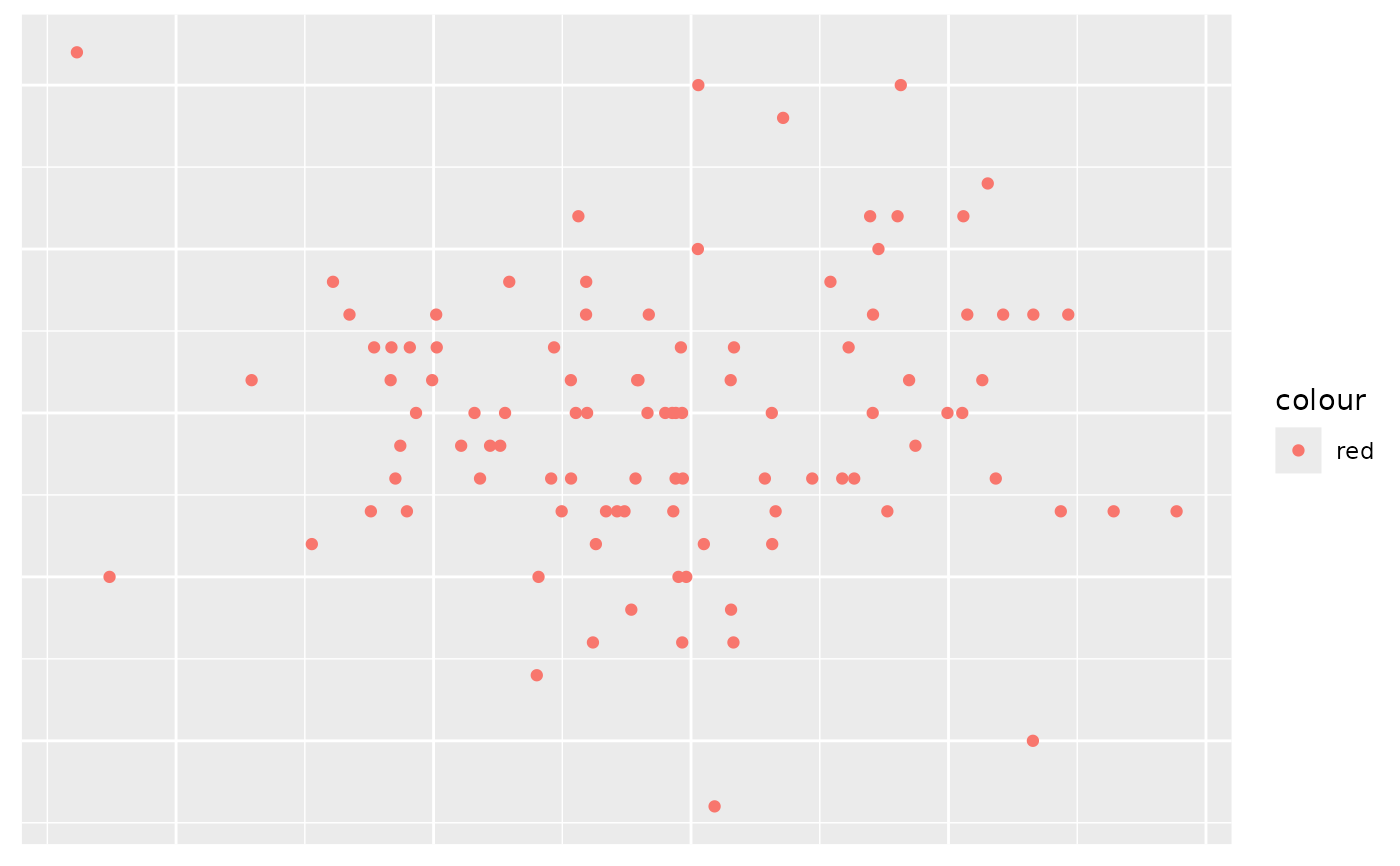
 # Generate a plot with no axes
library(ggplot2)
df <- data.frame(x = rnorm(n = 100, mean = 20, sd = 2), y = rbinom(n = 100, size = 100, prob = 0.2))
p <- ggplot(data = df, mapping = aes(x = x, y = y)) + geom_point(mapping = aes(color = 'red'))
p + NoAxes()
# Generate a plot with no axes
library(ggplot2)
df <- data.frame(x = rnorm(n = 100, mean = 20, sd = 2), y = rbinom(n = 100, size = 100, prob = 0.2))
p <- ggplot(data = df, mapping = aes(x = x, y = y)) + geom_point(mapping = aes(color = 'red'))
p + NoAxes()
 # Generate a plot with no legend
library(ggplot2)
df <- data.frame(x = rnorm(n = 100, mean = 20, sd = 2), y = rbinom(n = 100, size = 100, prob = 0.2))
p <- ggplot(data = df, mapping = aes(x = x, y = y)) + geom_point(mapping = aes(color = 'red'))
p + NoLegend()
# Generate a plot with no legend
library(ggplot2)
df <- data.frame(x = rnorm(n = 100, mean = 20, sd = 2), y = rbinom(n = 100, size = 100, prob = 0.2))
p <- ggplot(data = df, mapping = aes(x = x, y = y)) + geom_point(mapping = aes(color = 'red'))
p + NoLegend()
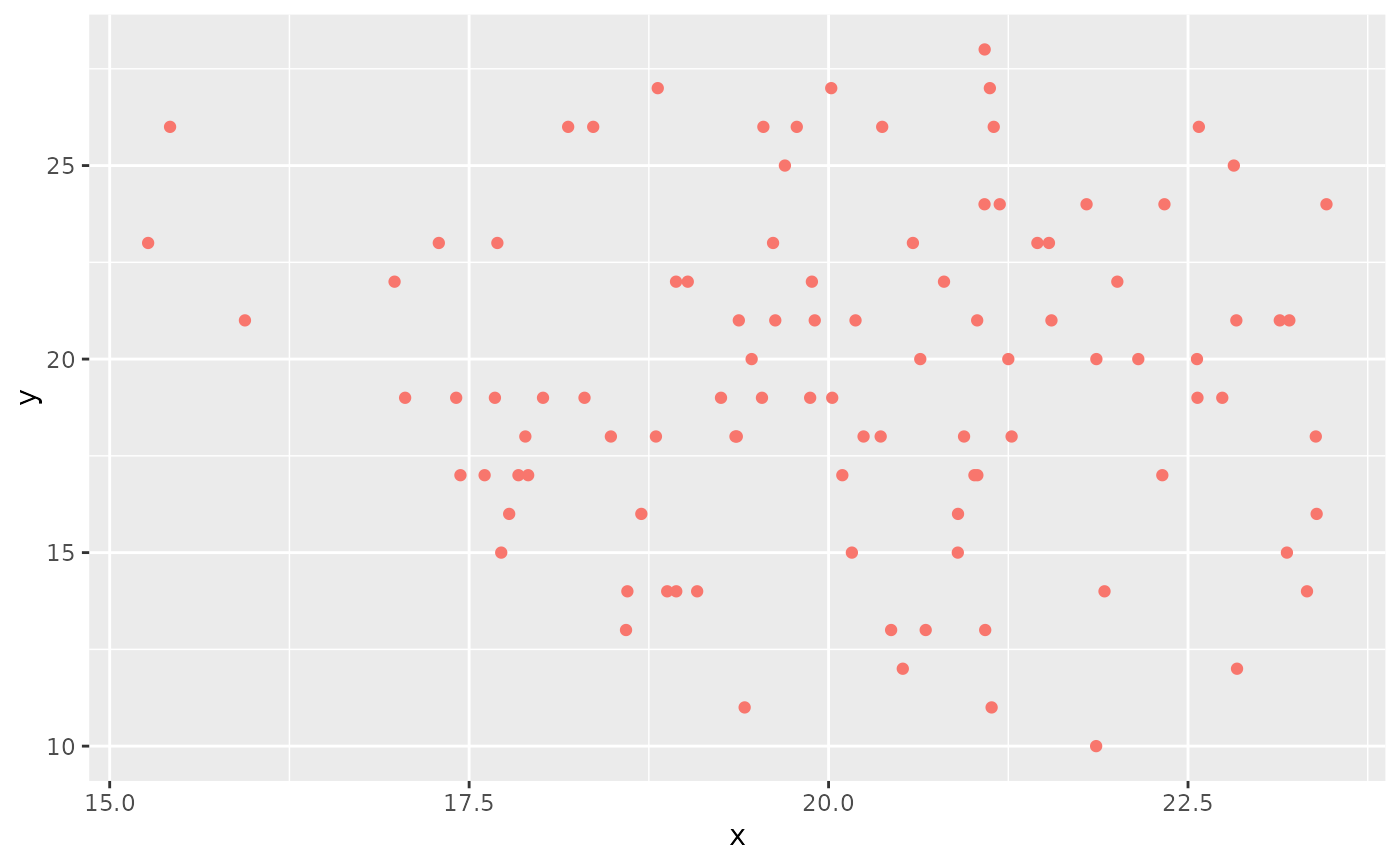 # Generate a plot with no grid lines
library(ggplot2)
df <- data.frame(x = rnorm(n = 100, mean = 20, sd = 2), y = rbinom(n = 100, size = 100, prob = 0.2))
p <- ggplot(data = df, mapping = aes(x = x, y = y)) + geom_point(mapping = aes(color = 'red'))
p + NoGrid()
# Generate a plot with no grid lines
library(ggplot2)
df <- data.frame(x = rnorm(n = 100, mean = 20, sd = 2), y = rbinom(n = 100, size = 100, prob = 0.2))
p <- ggplot(data = df, mapping = aes(x = x, y = y)) + geom_point(mapping = aes(color = 'red'))
p + NoGrid()