We provide a series of vignettes, tutorials, and analysis walkthroughs to help users get started with Seurat. You can also check out our Reference page which contains a full list of functions available to users.
Our previous Get Started page for Seurat v4 is archived here.
Introductory Vignettes
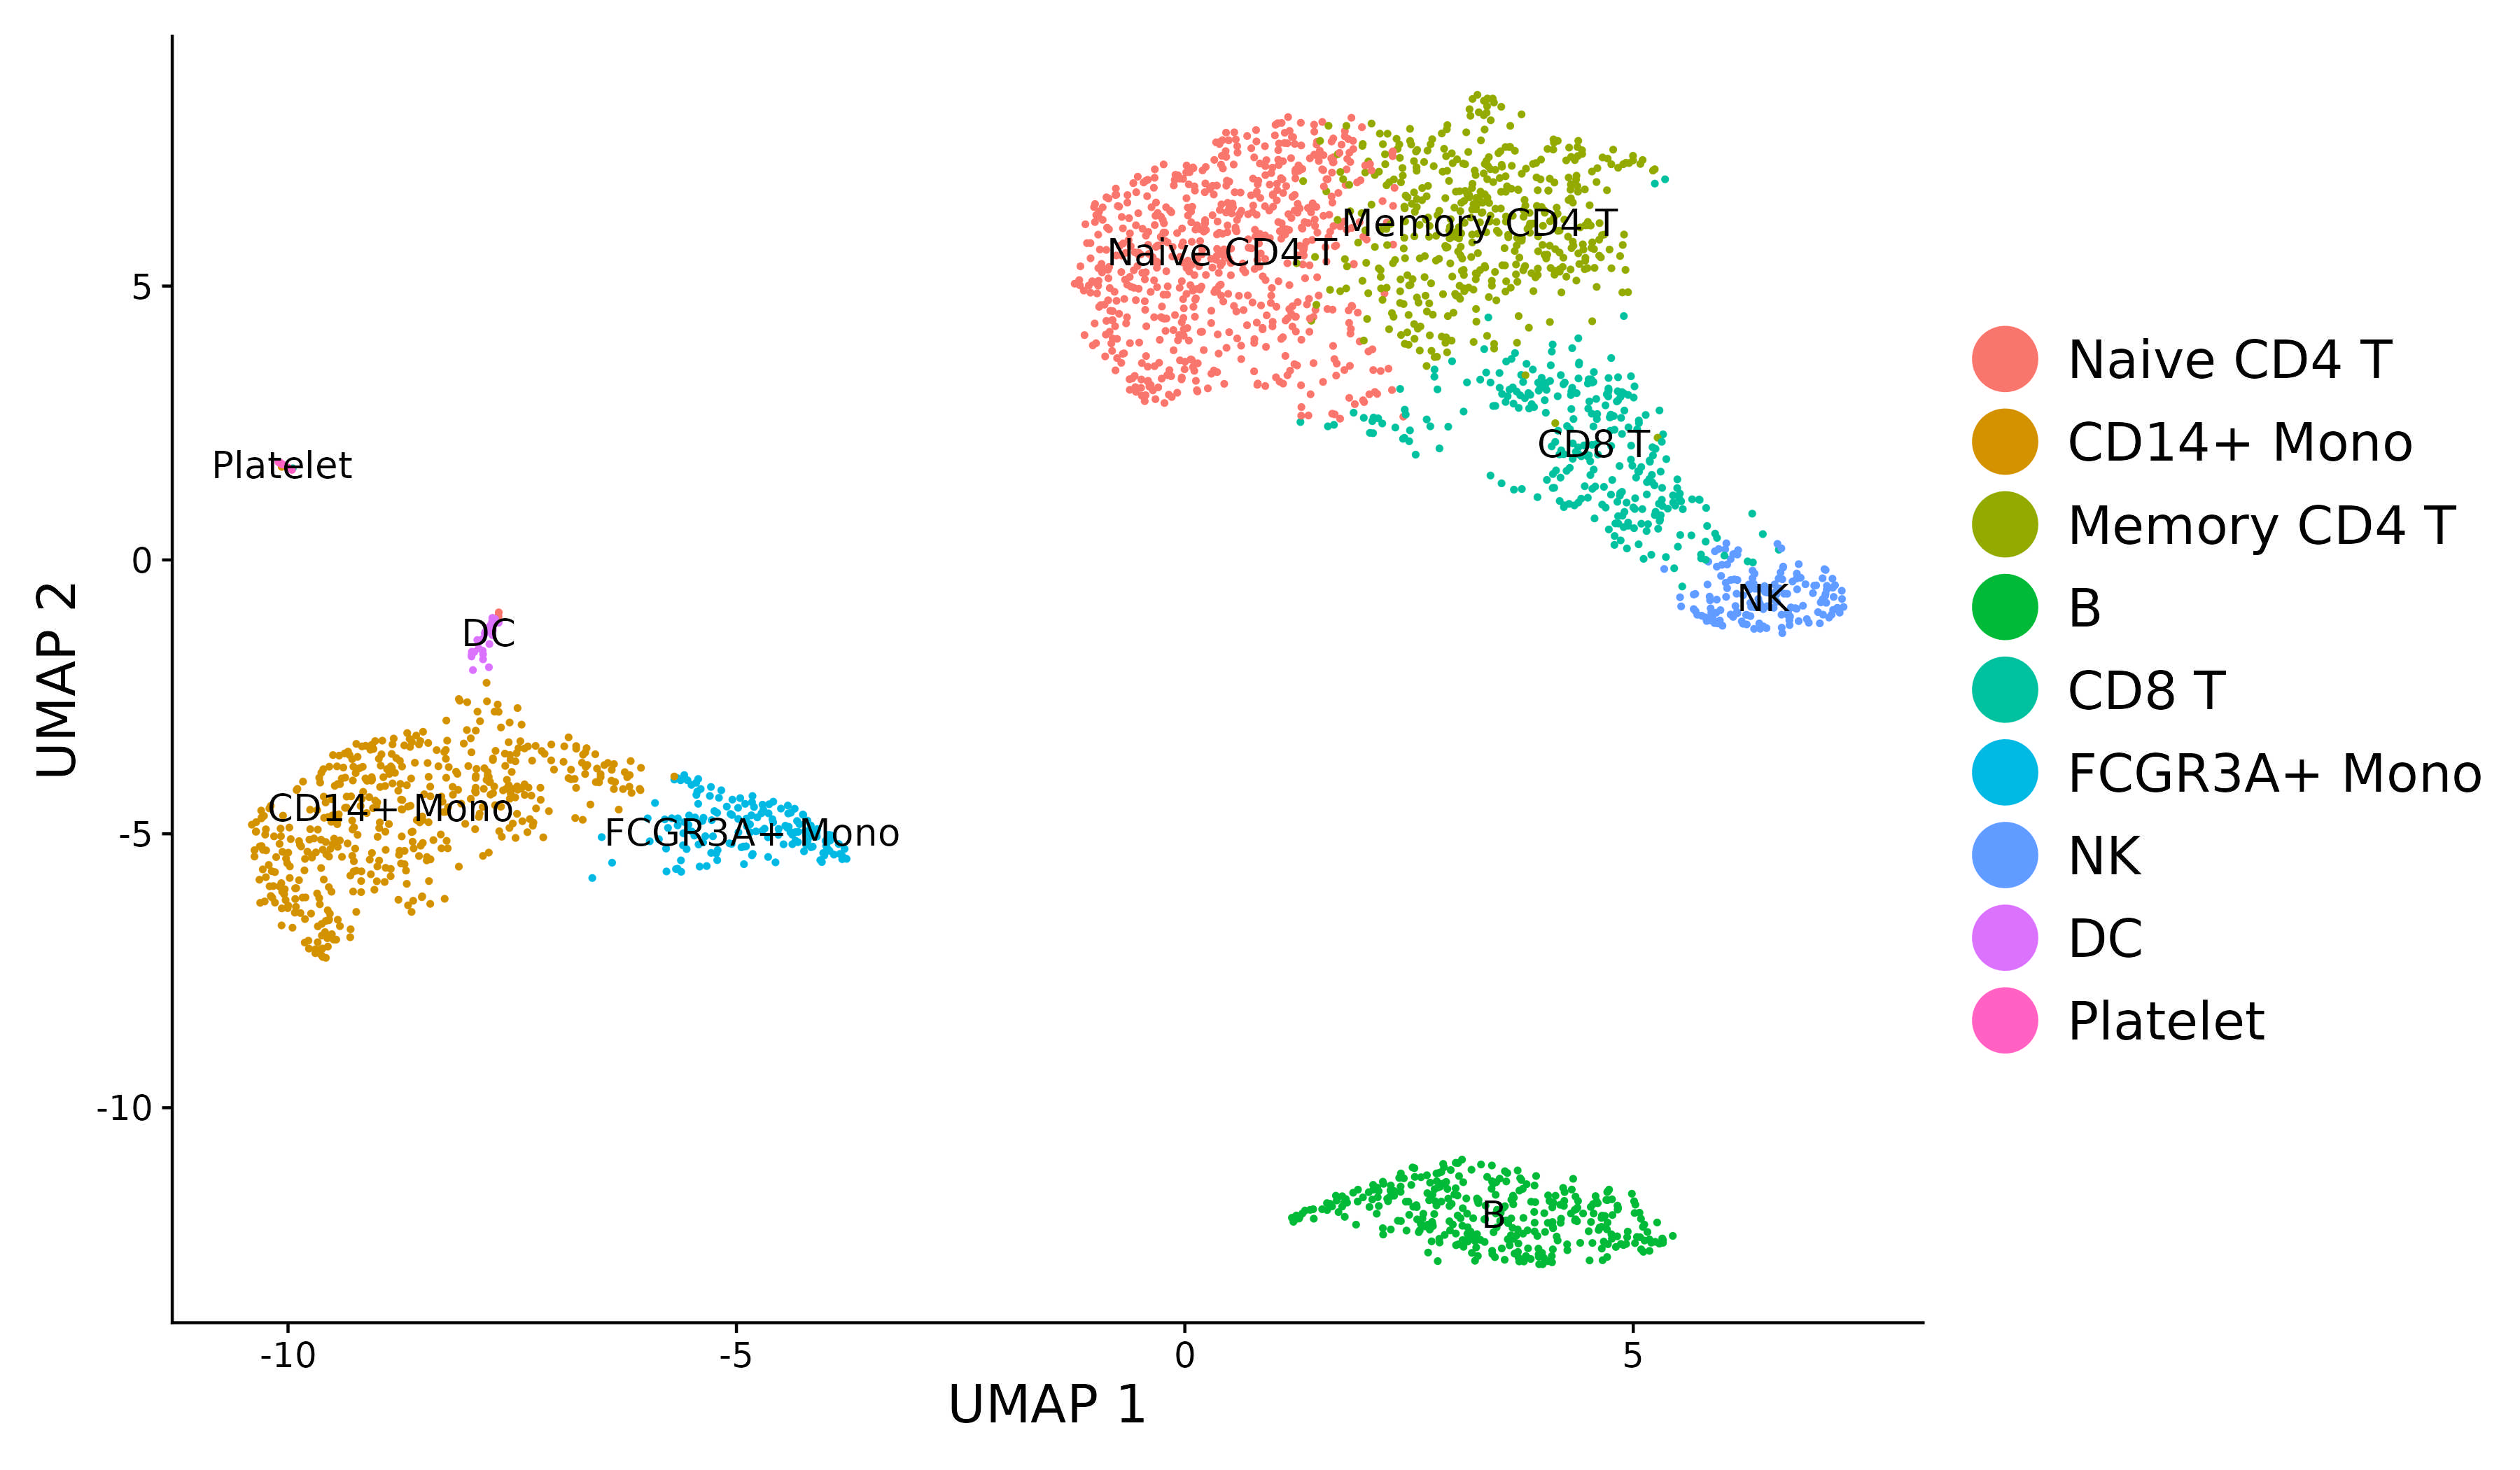
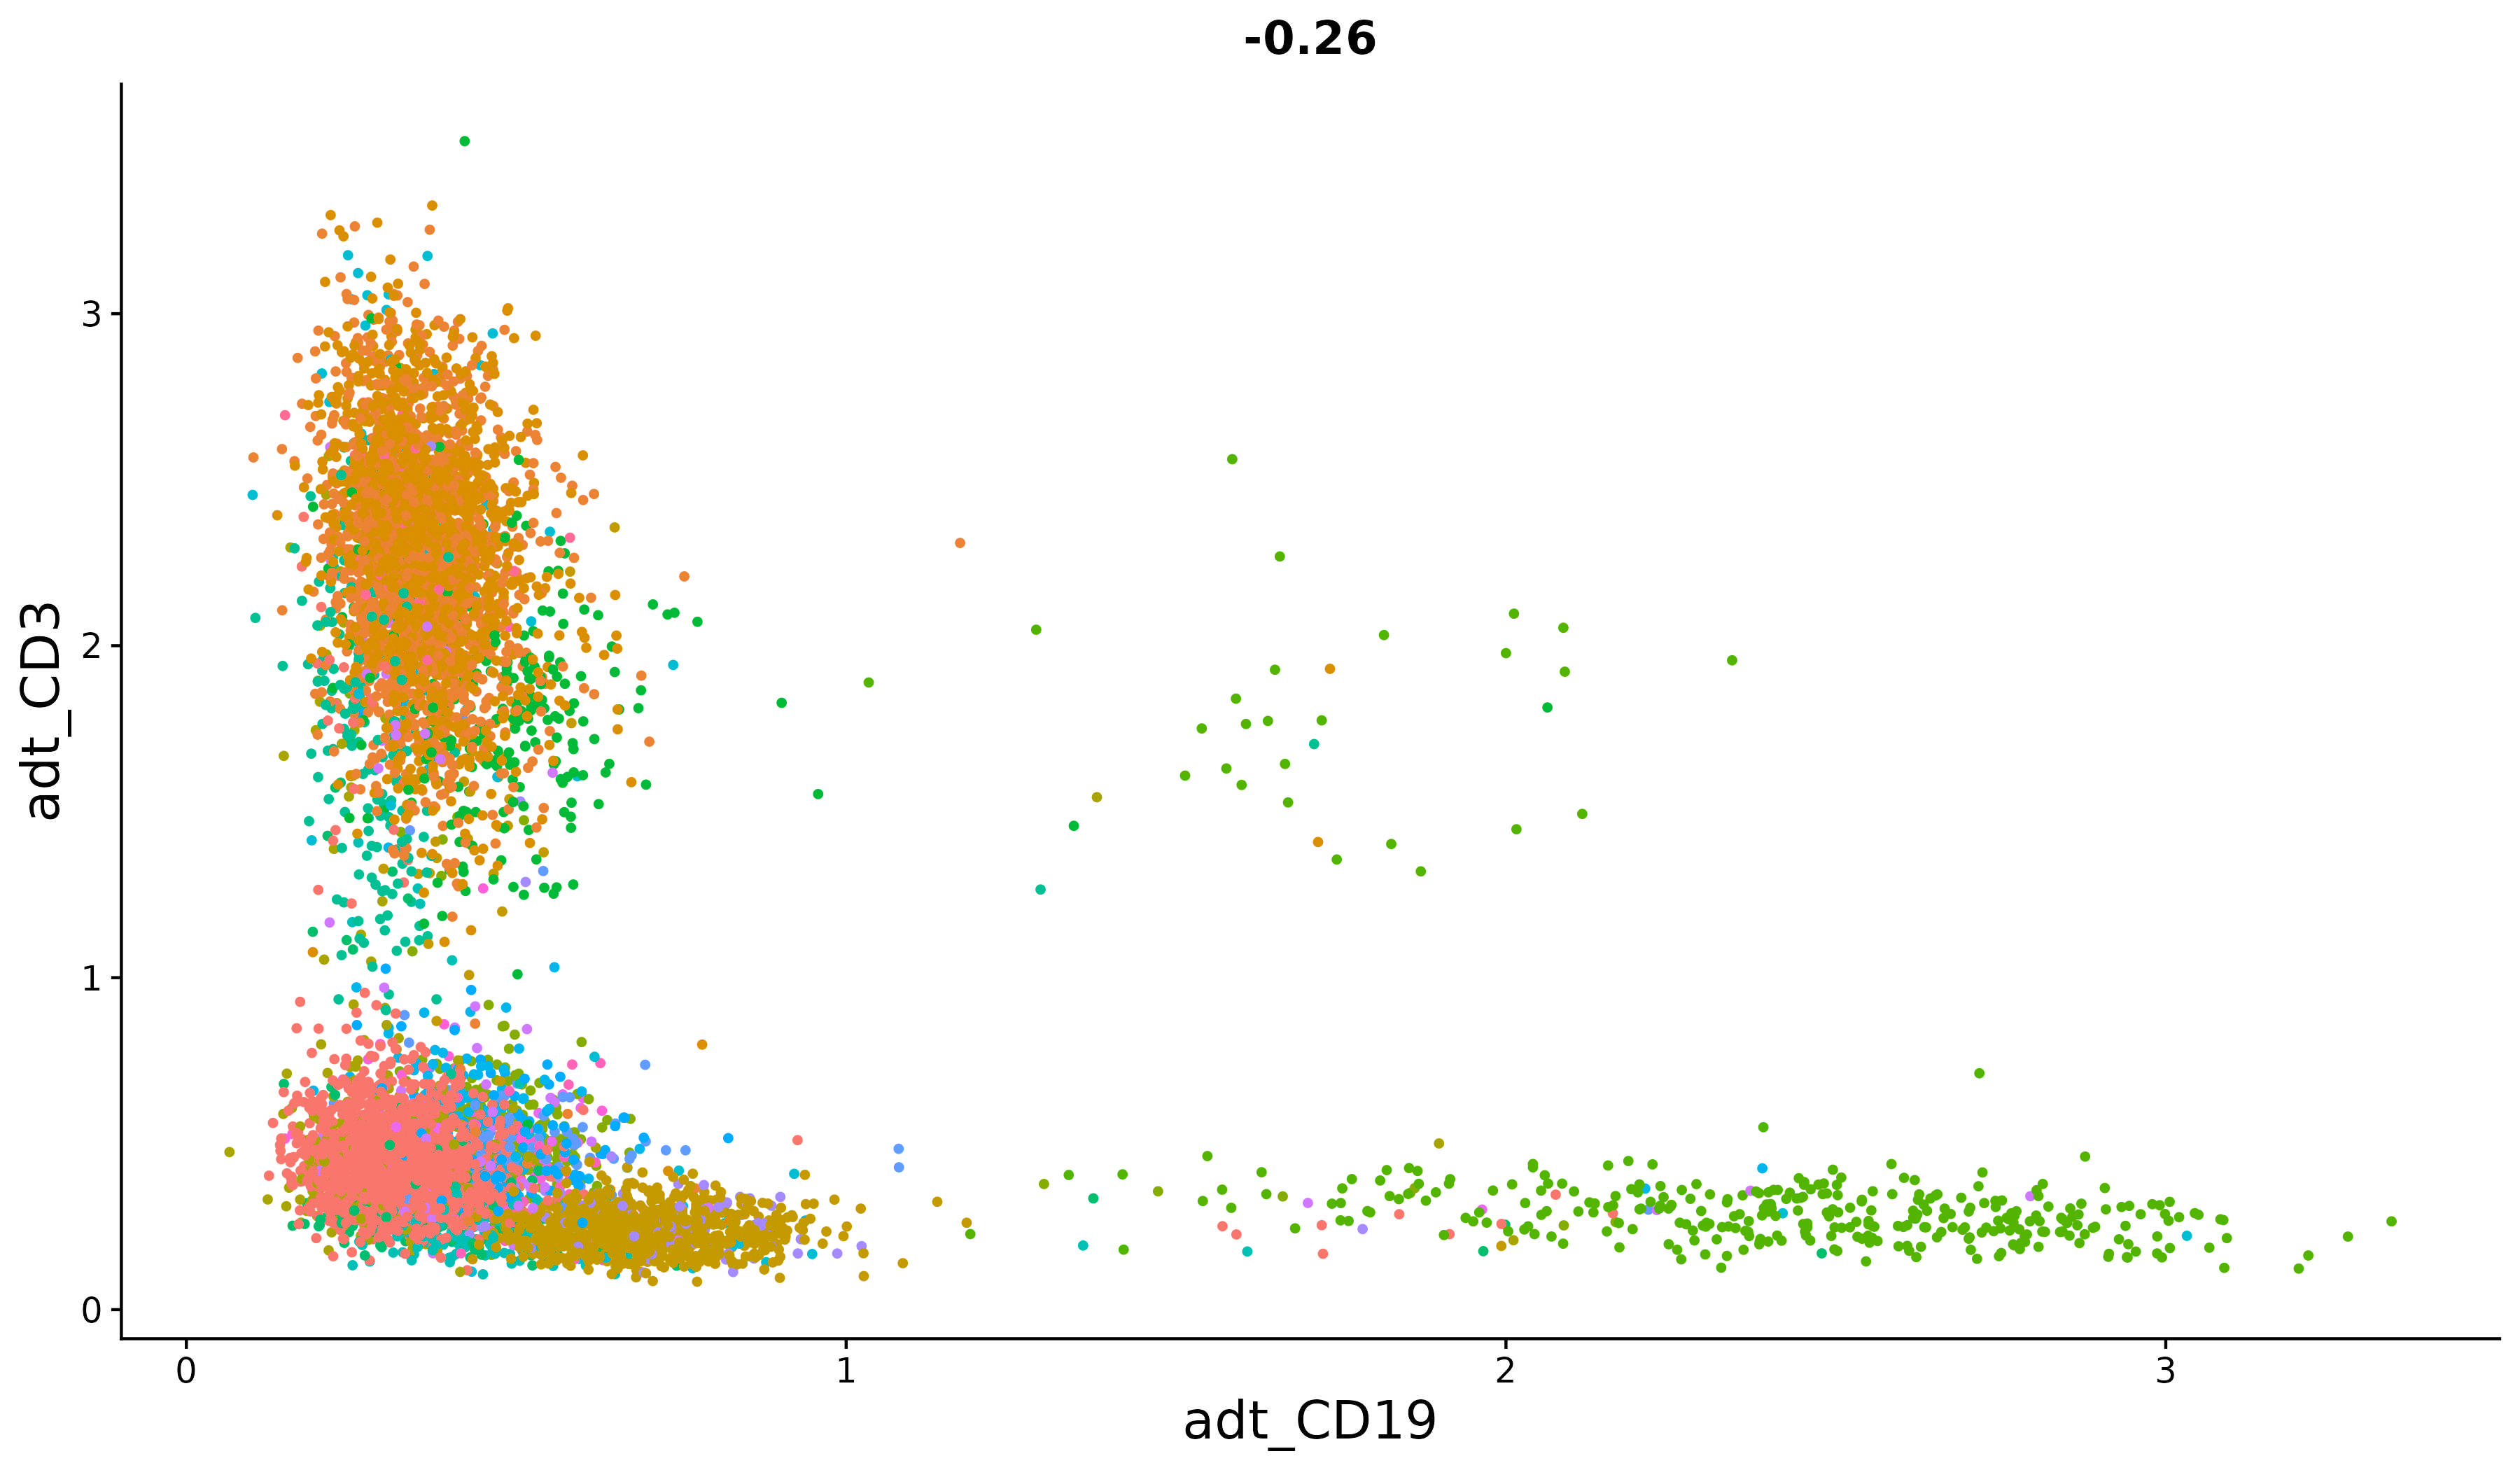
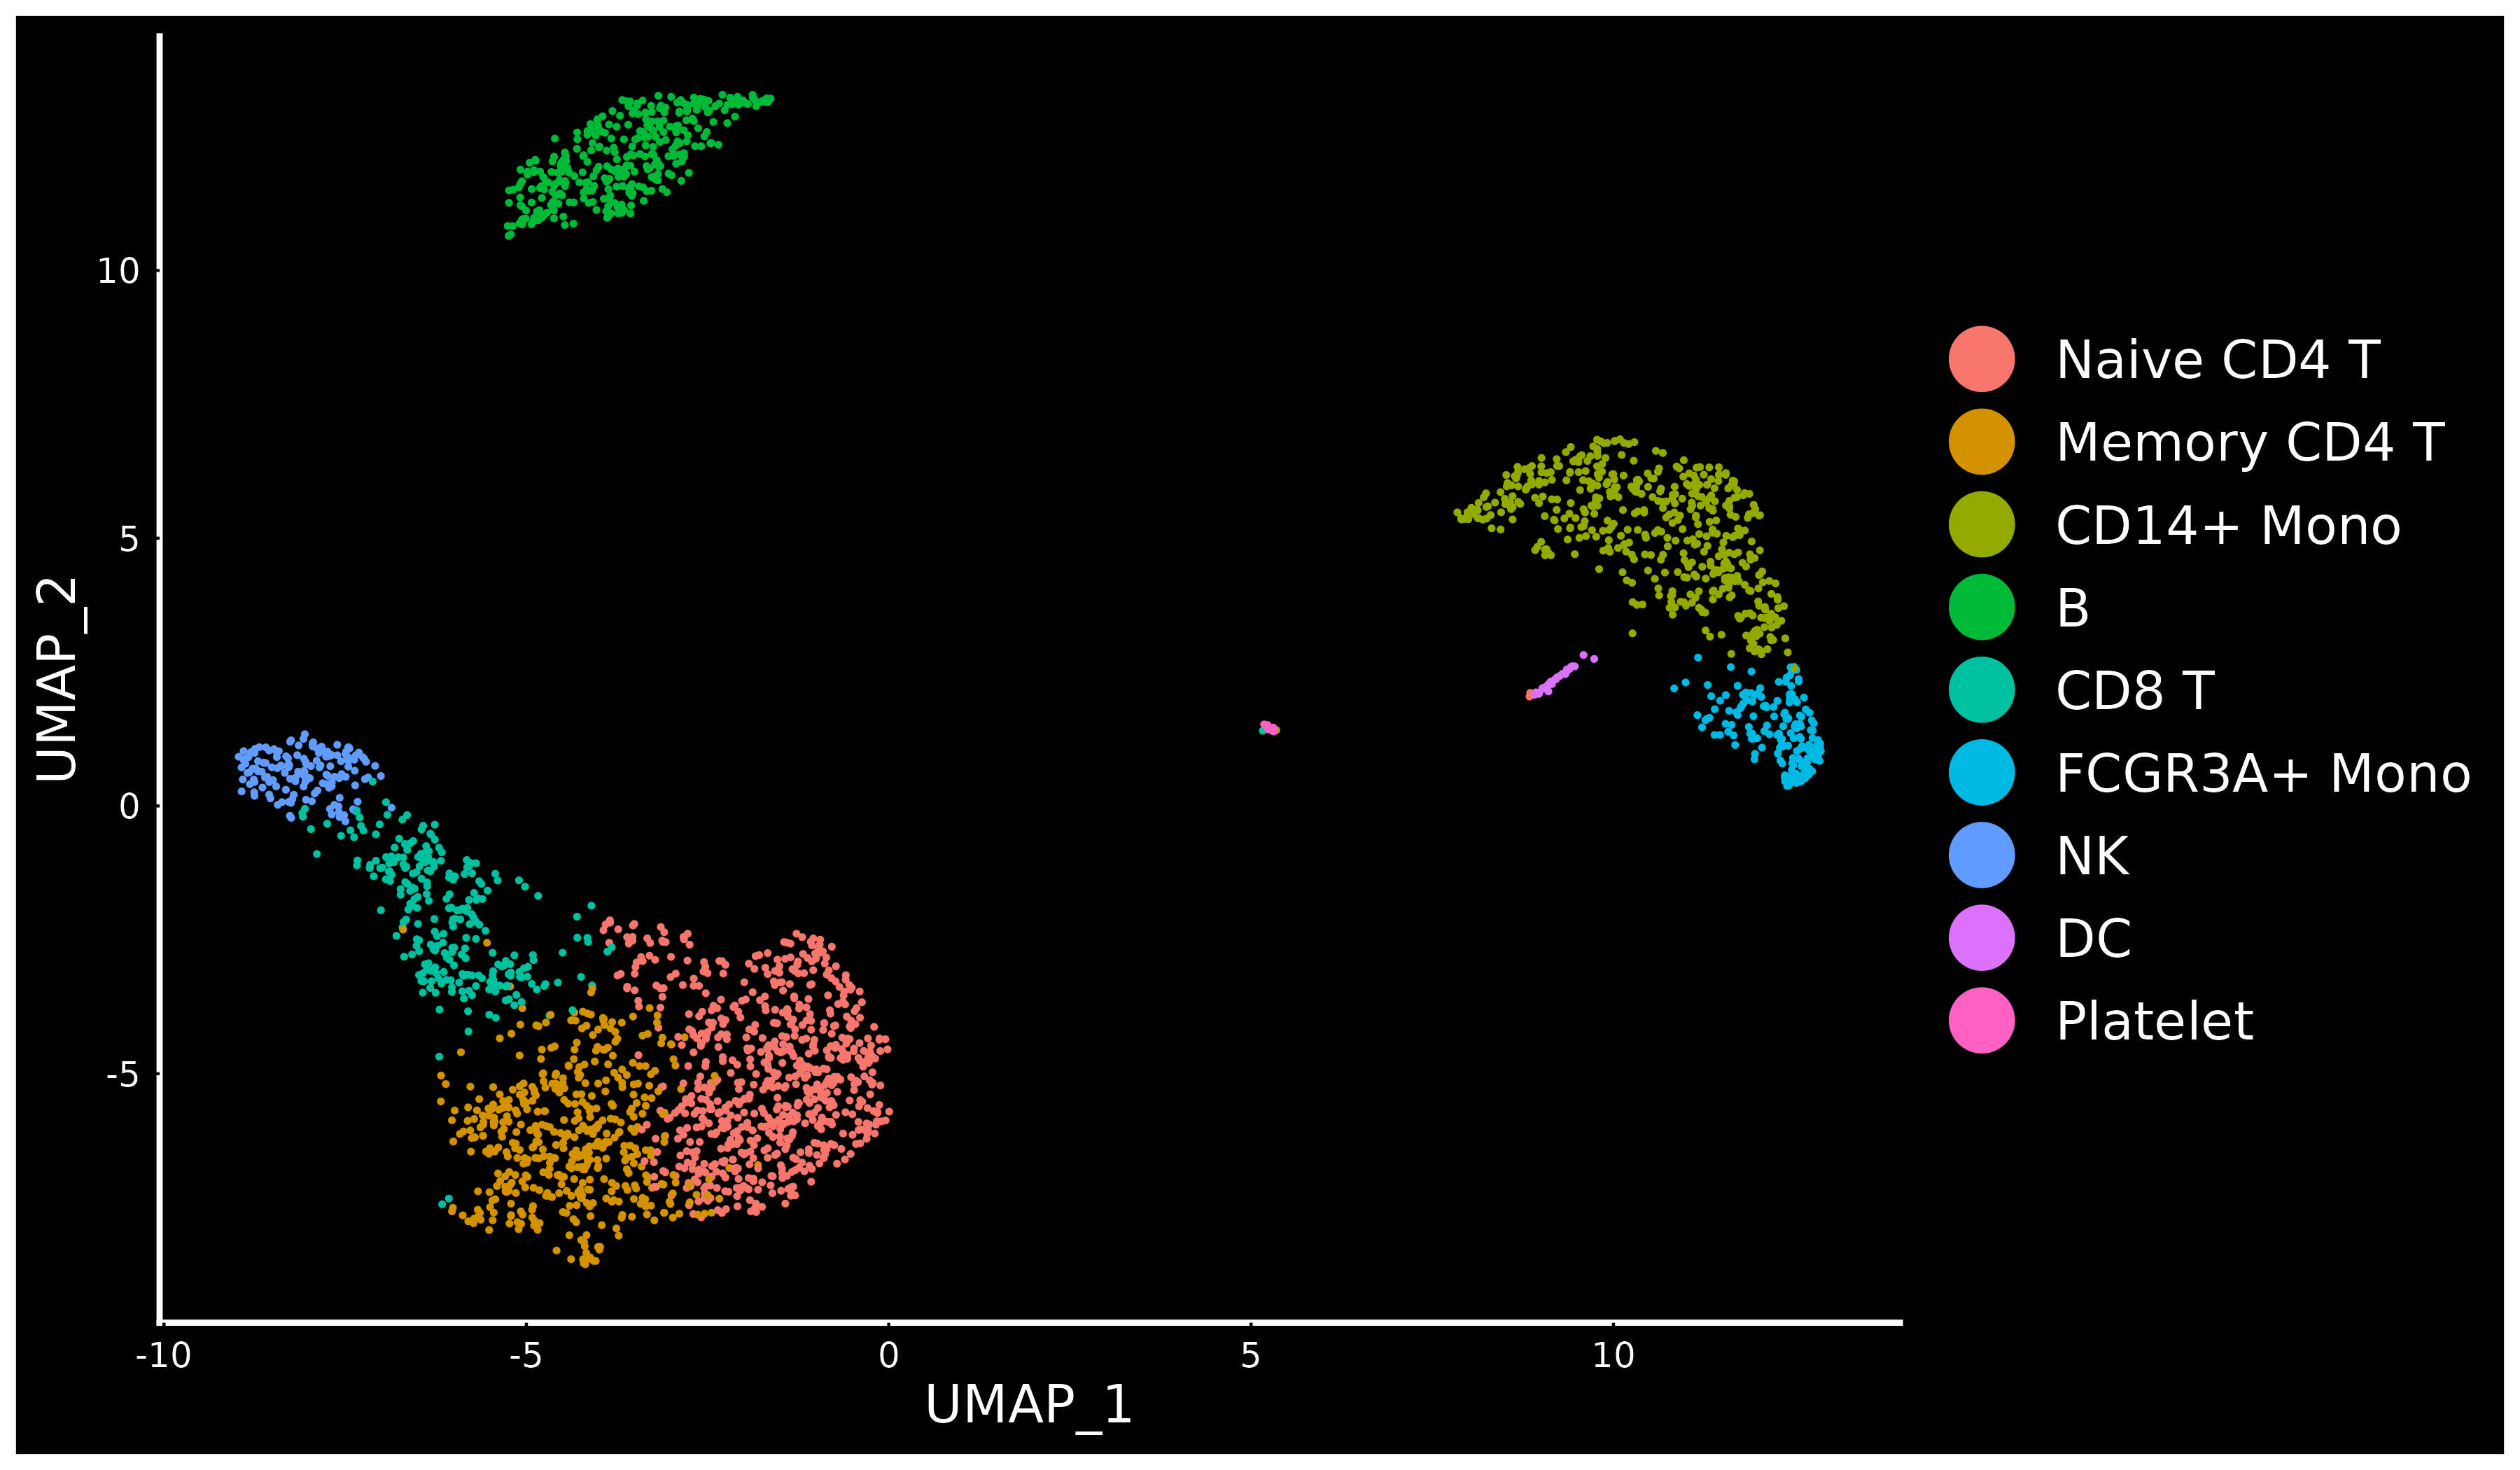
For new users of Seurat, we suggest starting with a guided walk through of a dataset of 2,700 Peripheral Blood Mononuclear Cells (PBMCs) made publicly available by 10X Genomics. This tutorial implements the major components of a standard unsupervised clustering workflow including QC and data filtration, calculation of high-variance genes, dimensional reduction, graph-based clustering, and the identification of cluster markers. We provide additional vignettes introducing visualization techniques in Seurat, the sctransform normalization workflow, and storage/interaction with multimodal datasets. We also provide an ‘essential commands cheatsheet’ as a quick reference.
|
|
|
| A basic overview of Seurat that includes an introduction to common analytical workflows. | An introduction to working with multi-modal datasets in Seurat. | An overview of the visualization capabilities within Seurat. |
| GO | GO | GO |
|
|
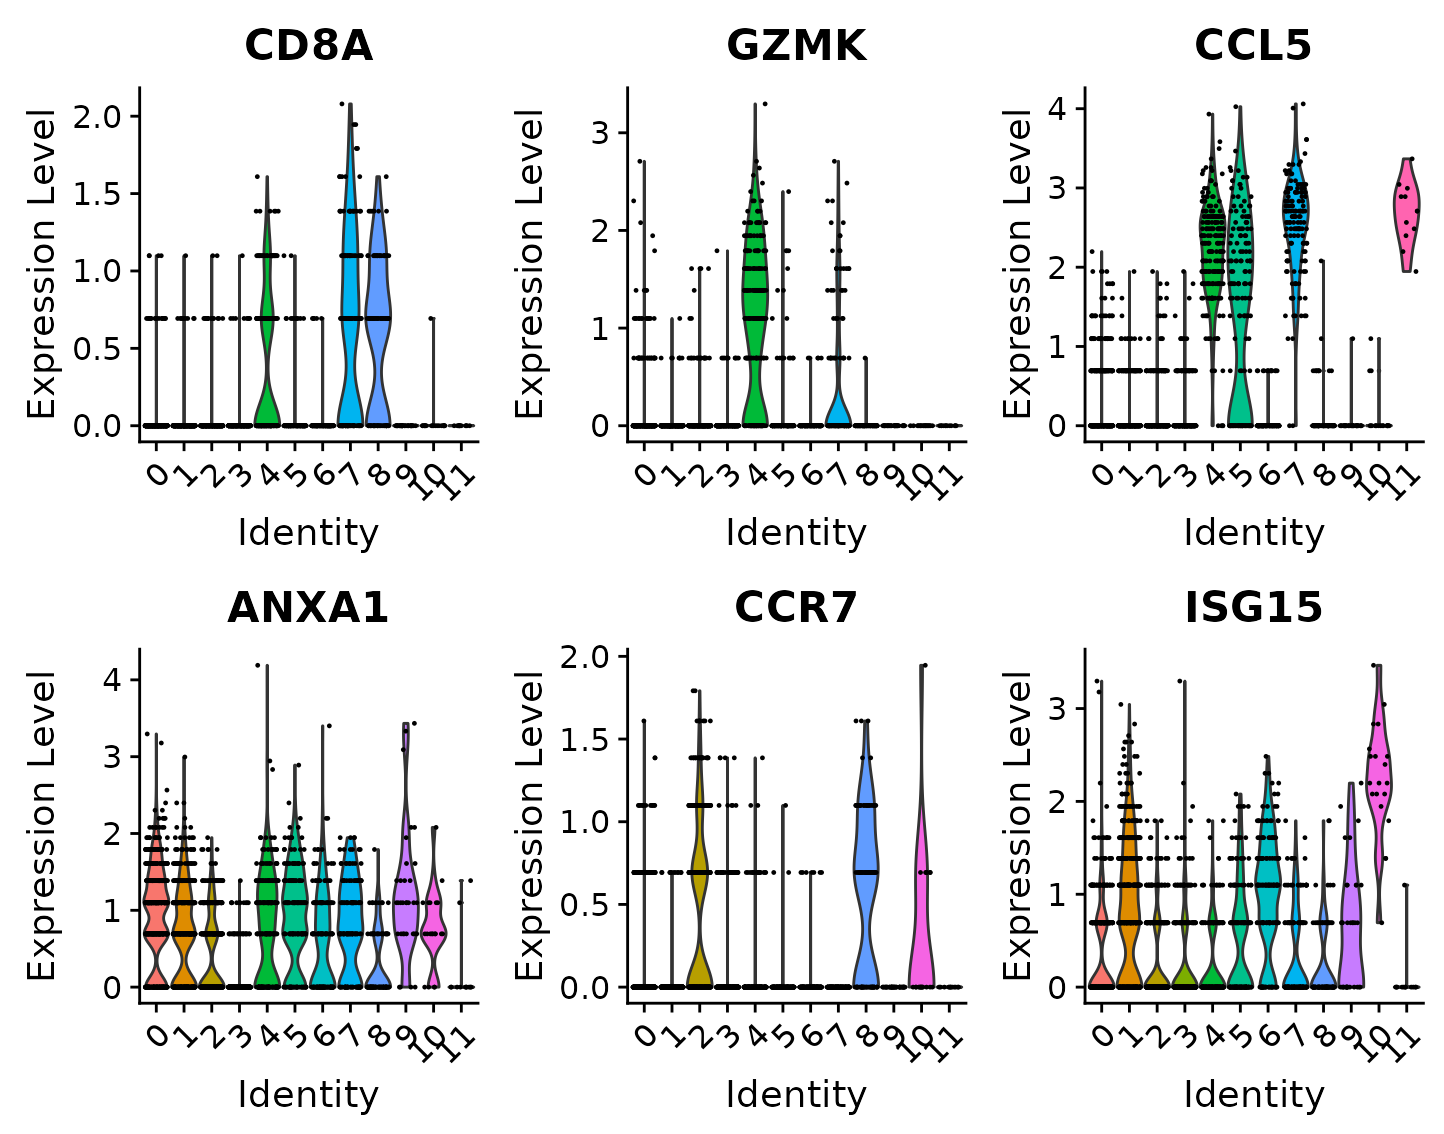
| Examples of how to perform normalization, feature selection, integration, and differential expression with an updated version of sctransform. | Reference list of commonly used commands to store, access, explore, and analyze datasets. |
| GO | GO |
scRNA Data Integration
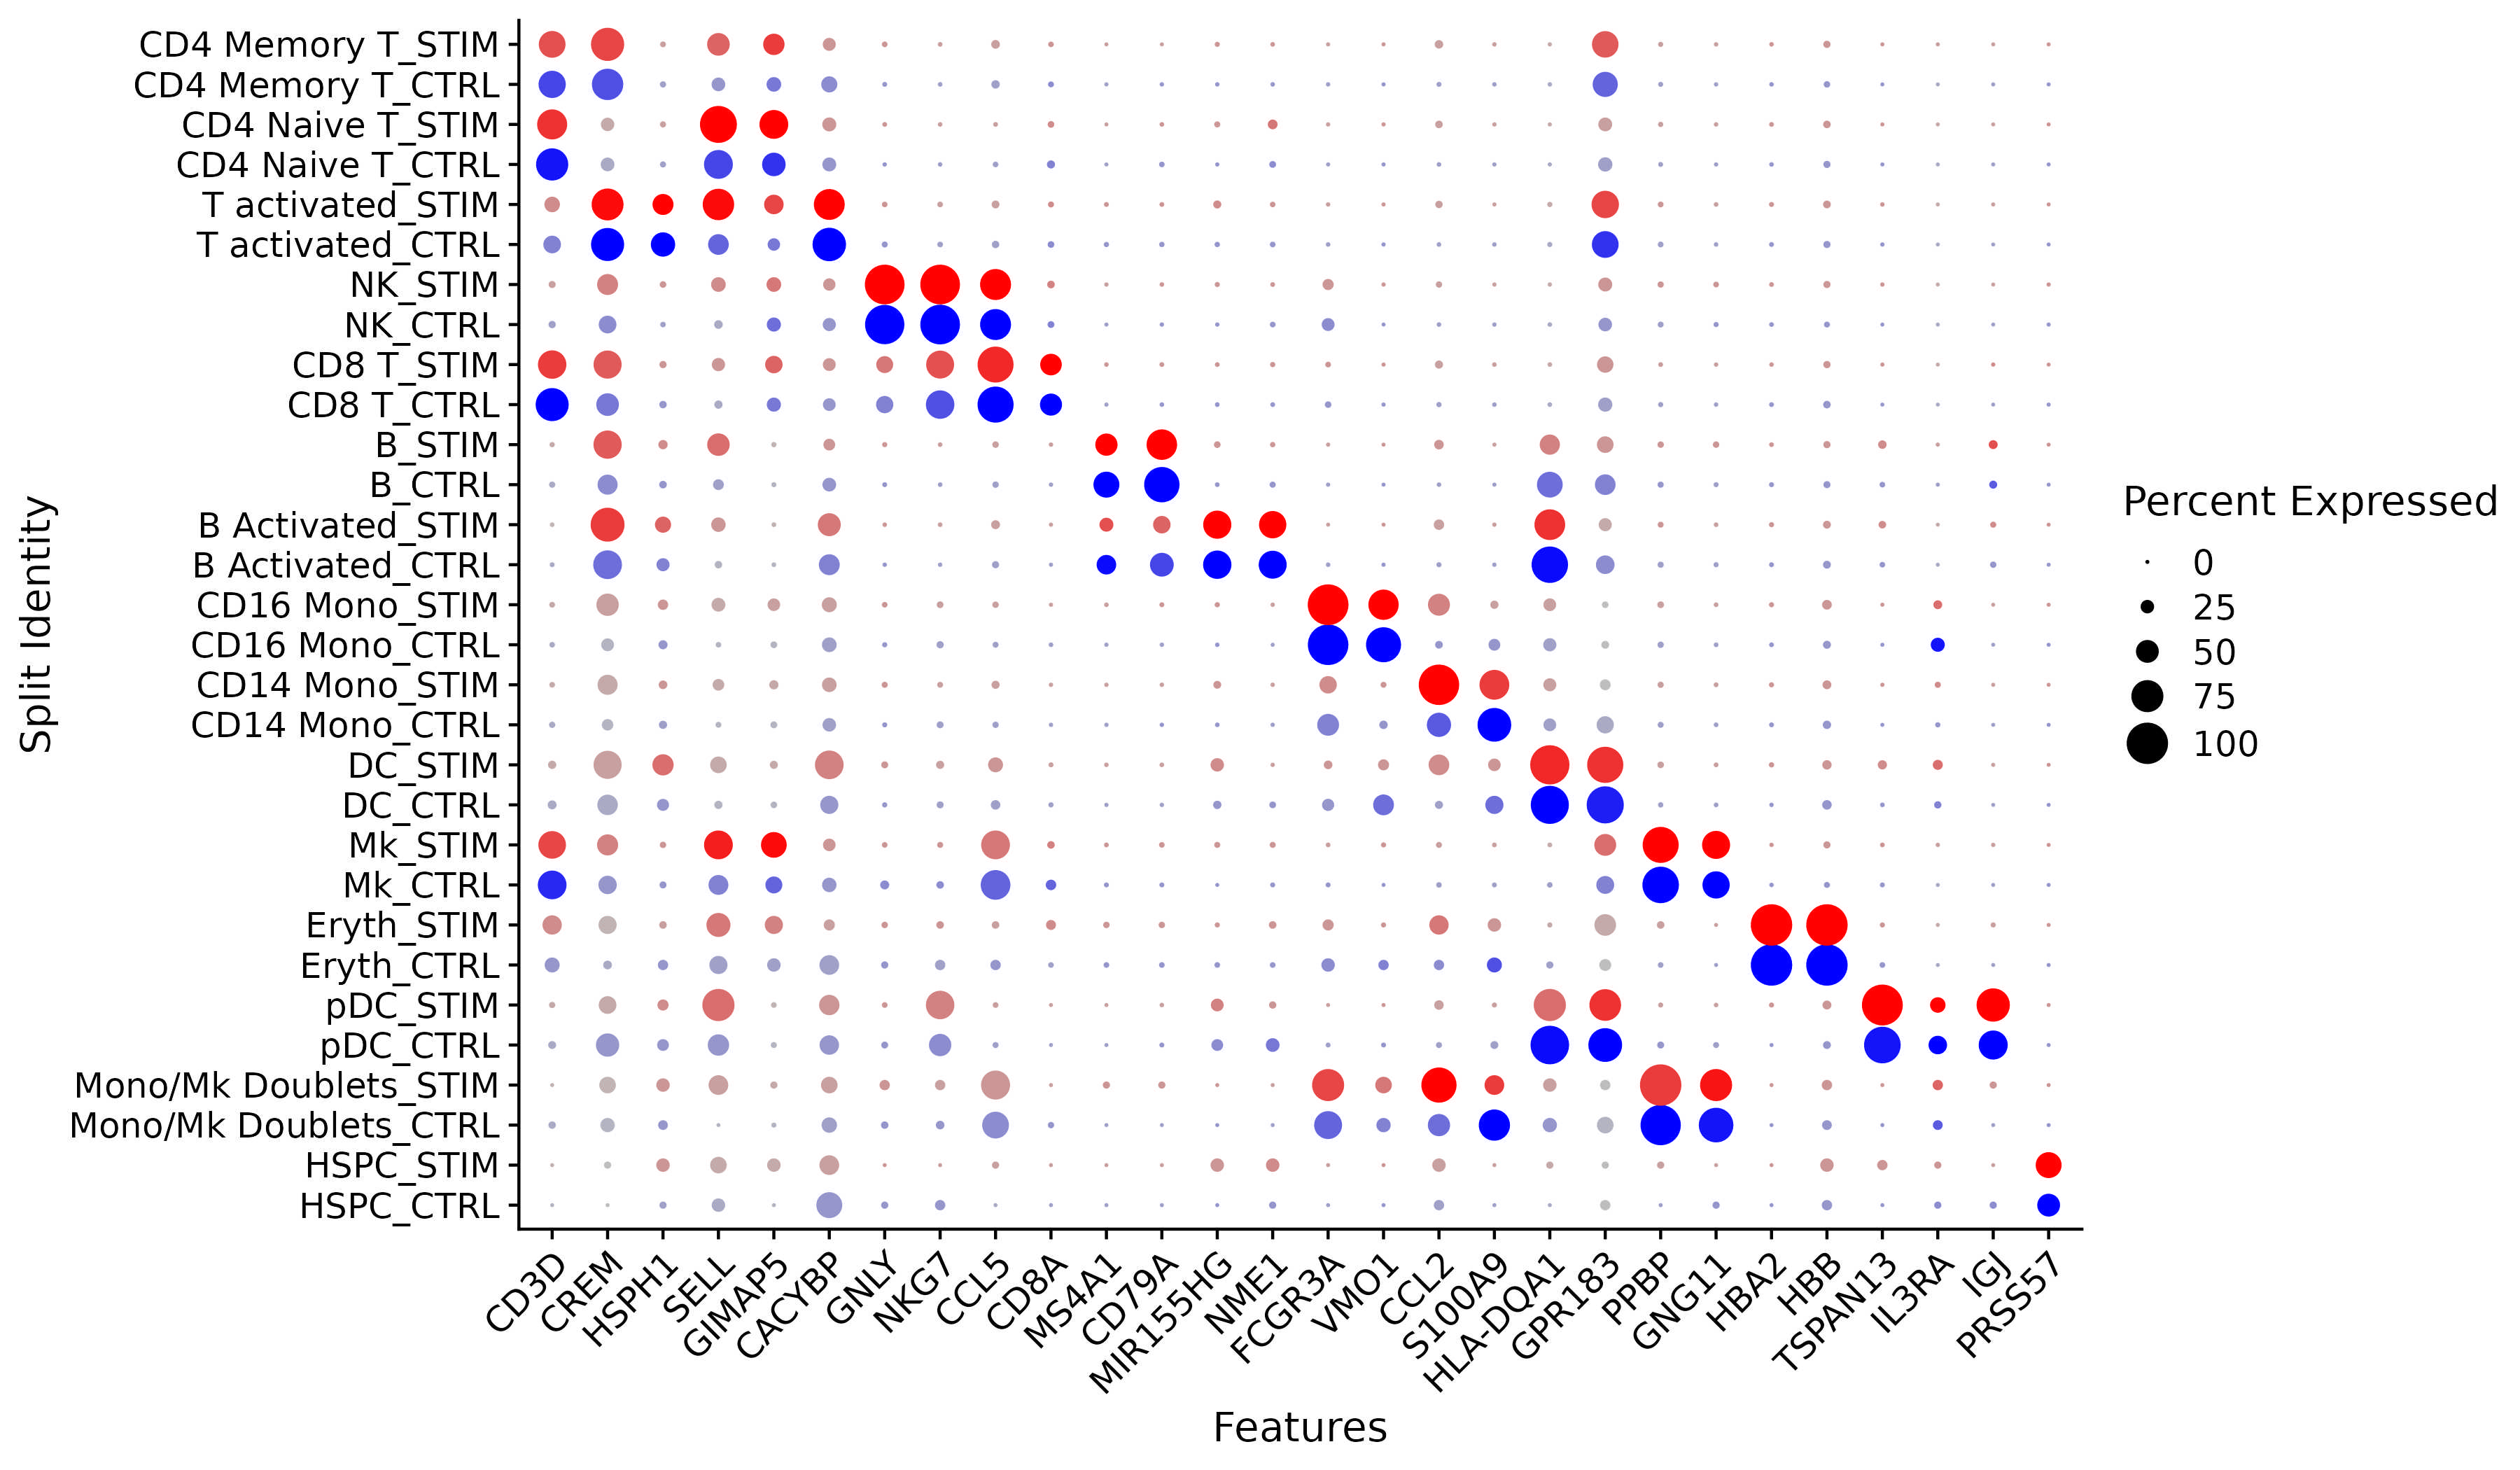
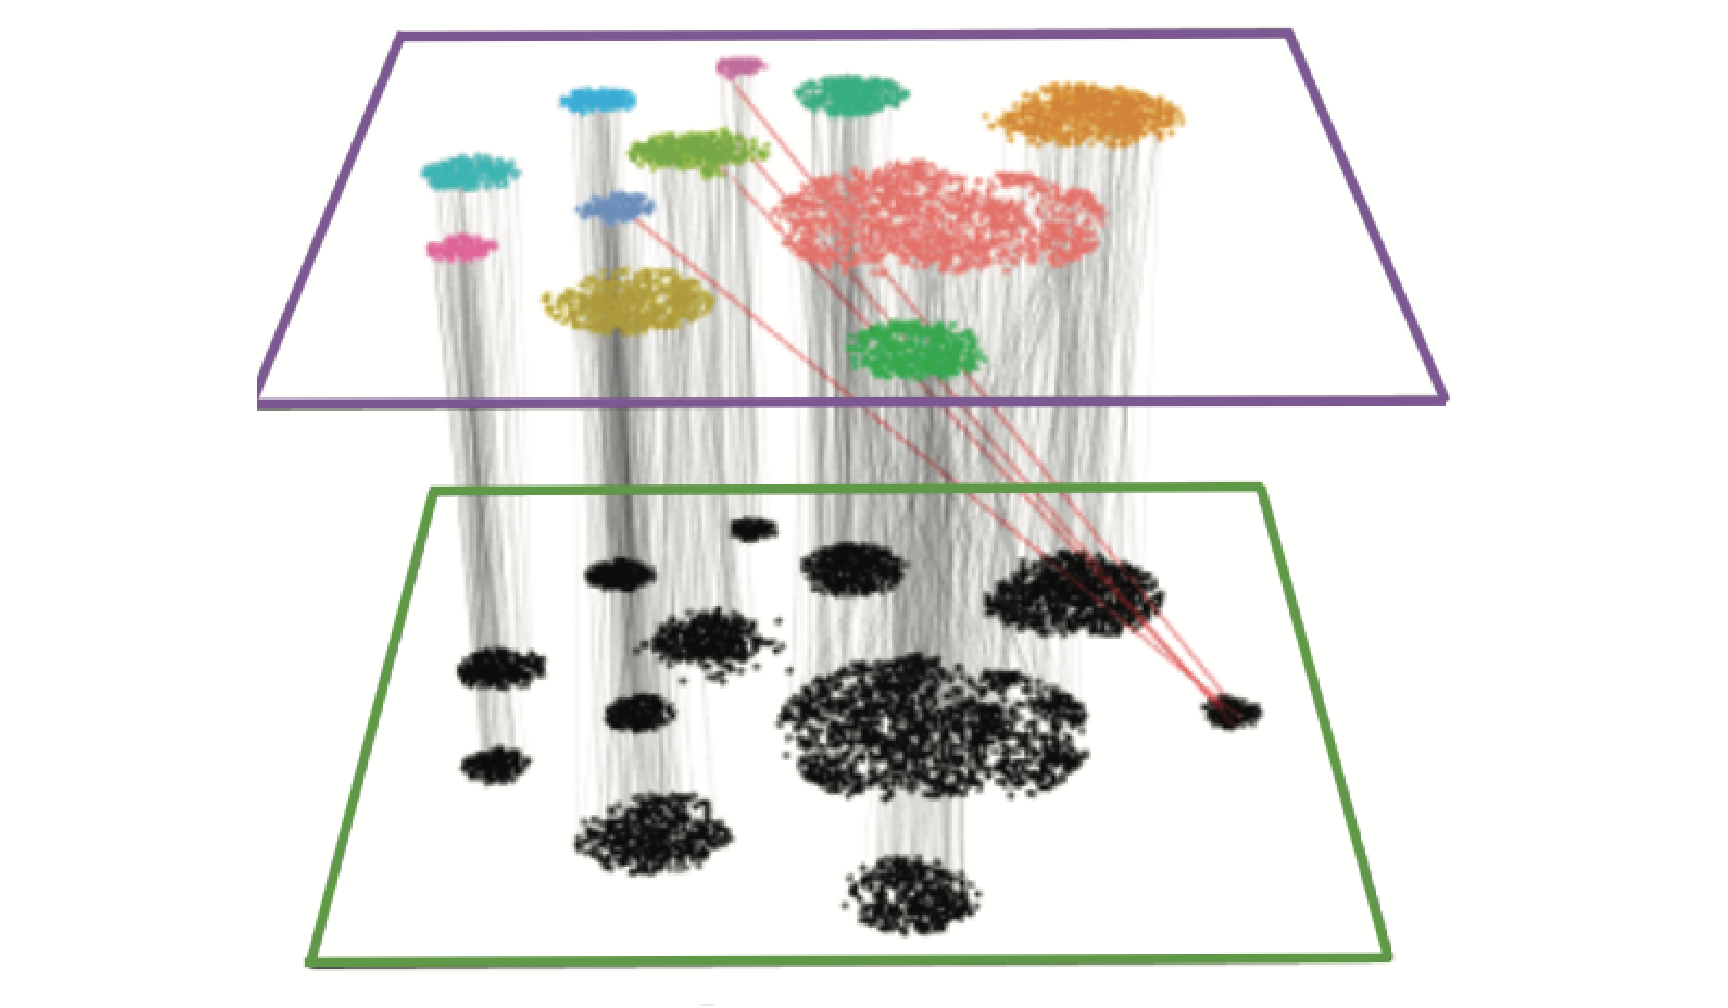
We have developed computational methods for integrated analysis of single-cell datasets generated across different conditions, technologies, or species. As an example, we provide a guided walk through for integrating and comparing PBMC datasets generated under different stimulation conditions. We provide additional vignettes demonstrating how to leverage an annotated scRNA-seq reference to map and label cells from a query, and to efficiently integrate large datasets.
|
|
|
| An introduction to integrating scRNA-seq datasets in order to identify and compare shared cell types across experiments. | Integrate scRNA-seq datasets using a variety of computational methods. | Learn how to map a query scRNA-seq dataset onto a reference in order to automate the annotation and visualization of query cells. |
| GO | GO | GO |
Multi-assay data
Seurat also offers support for a suite of statistical methods for analyzing multimodal single-cell data. These include methods to integrate modalities that are simultaneously measured in the same cells, modalities that are measured in different cells, and techniques to analyze pooled CRISPR screens.
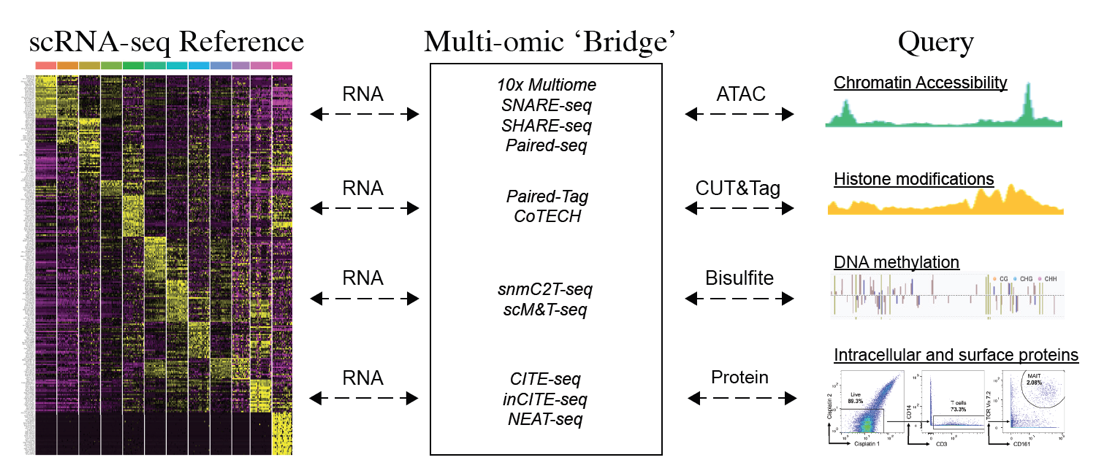
|
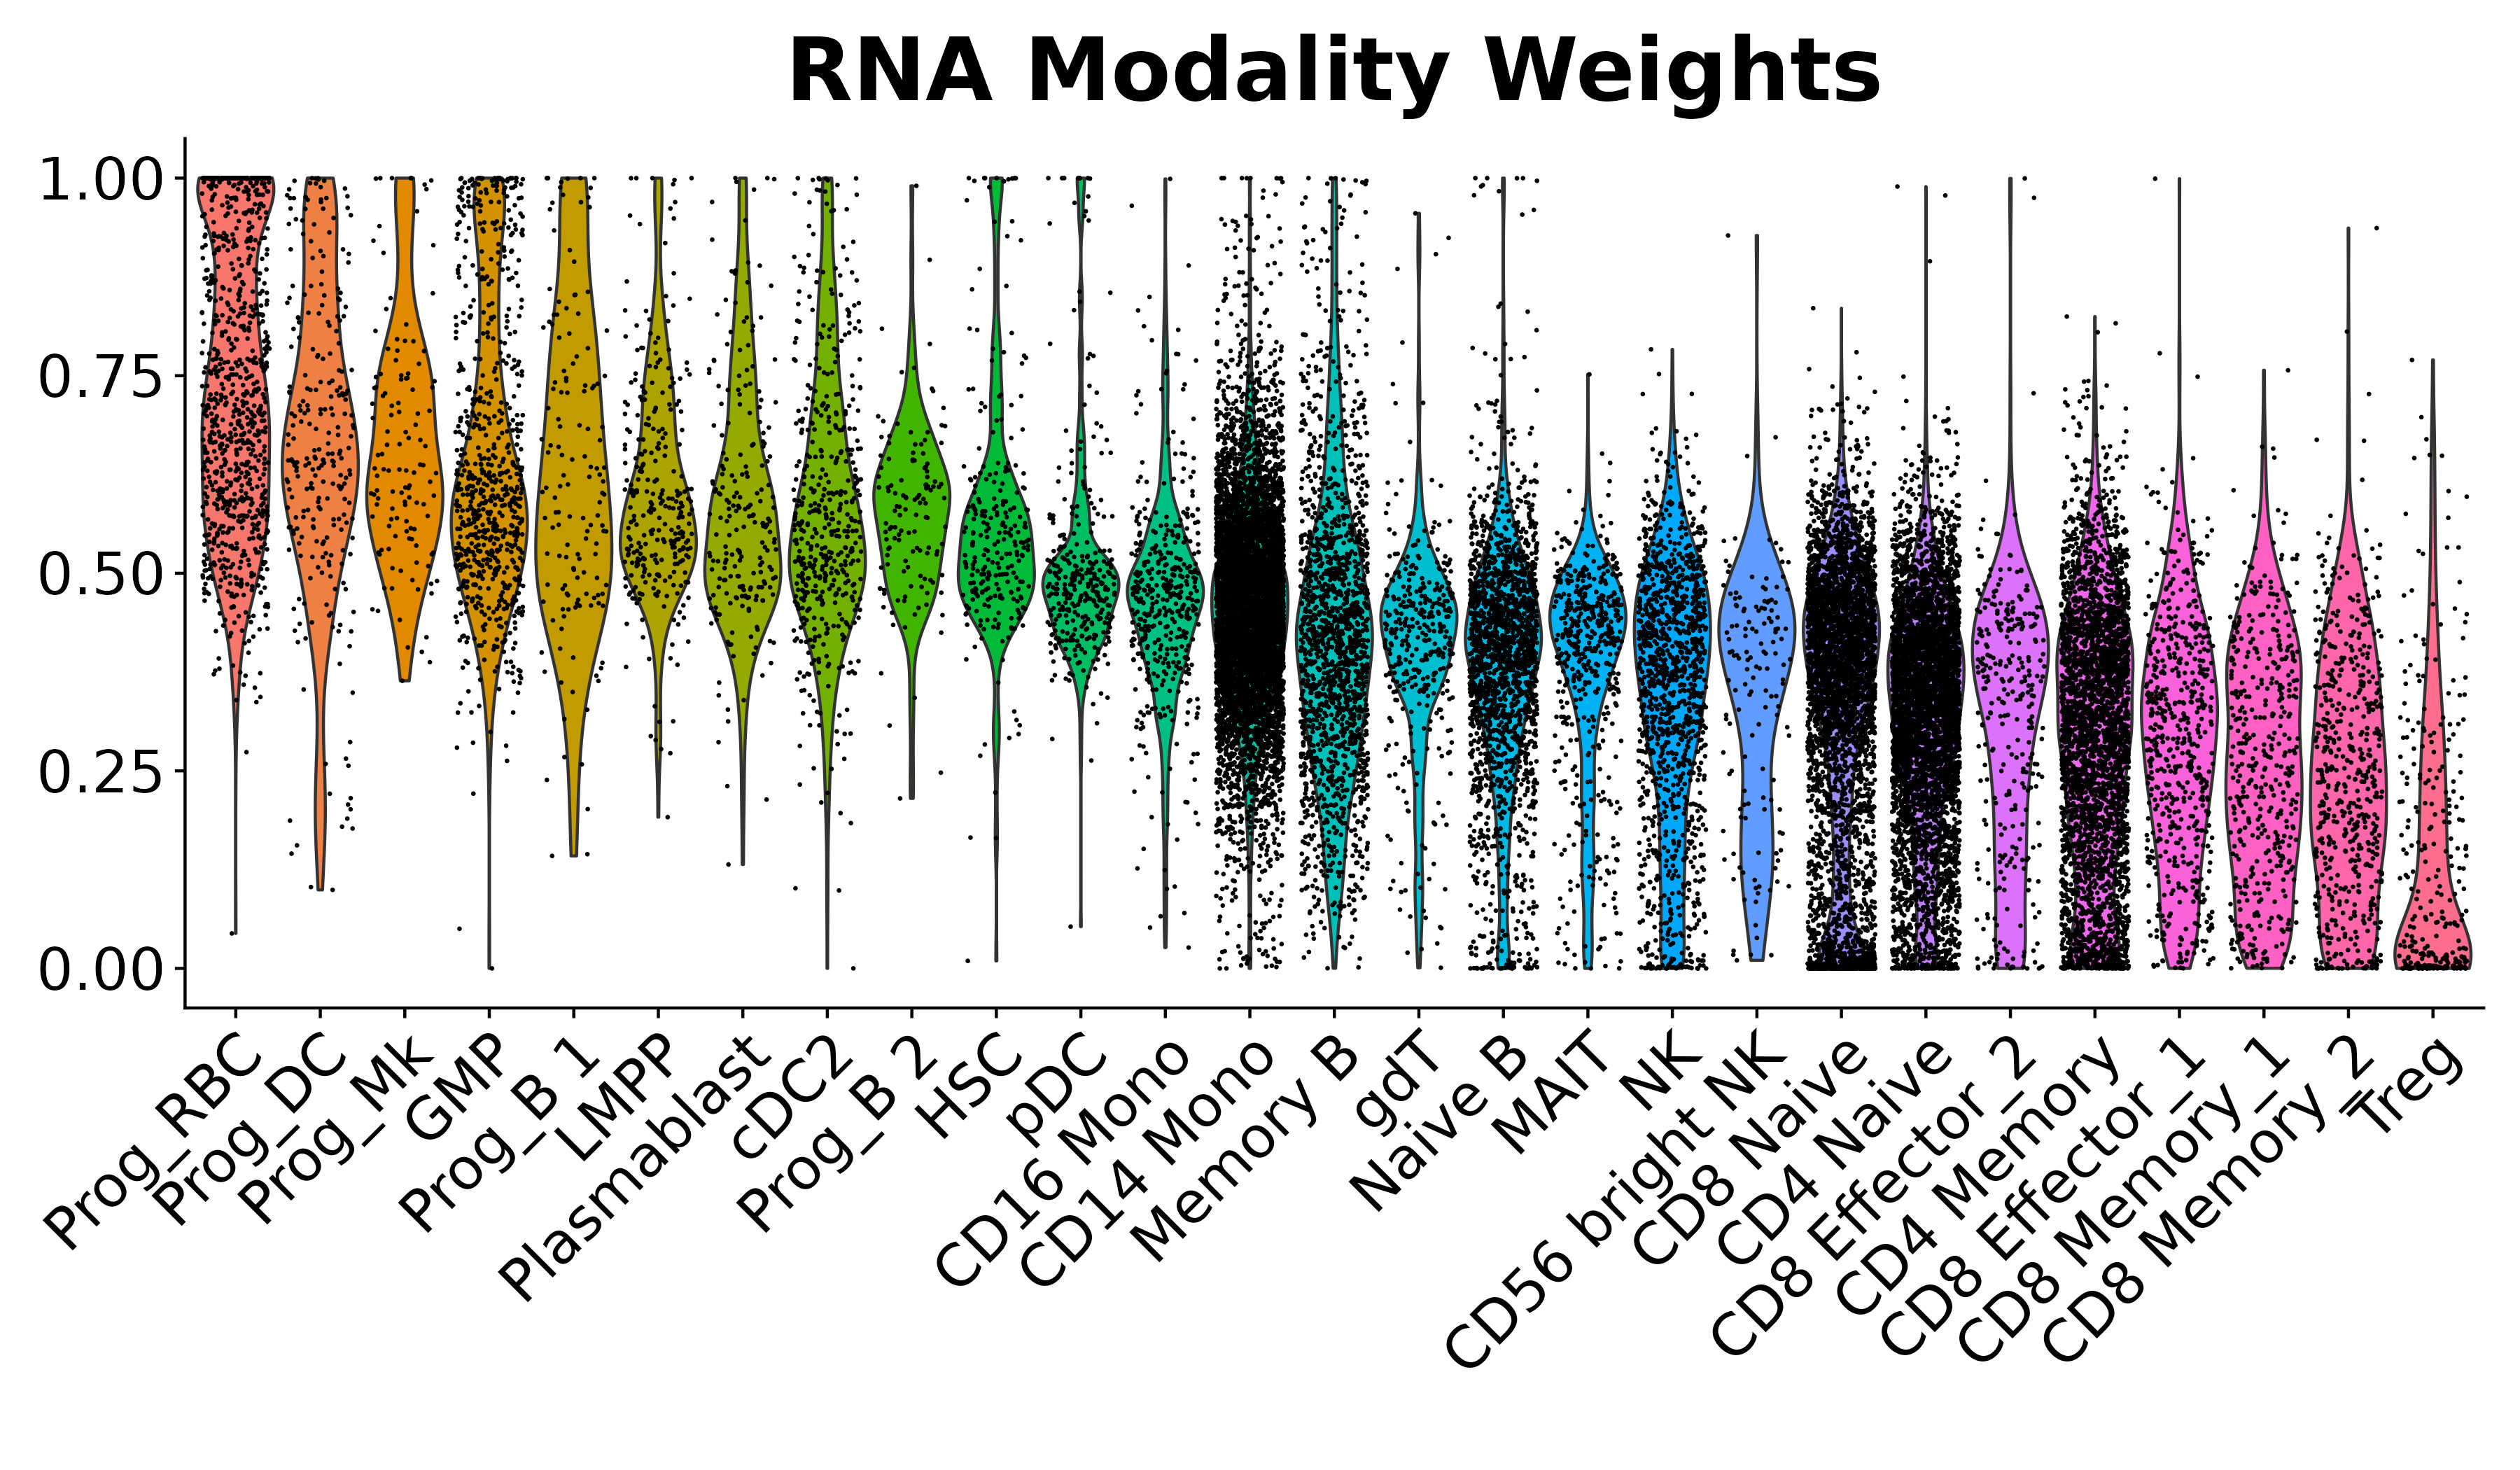
|
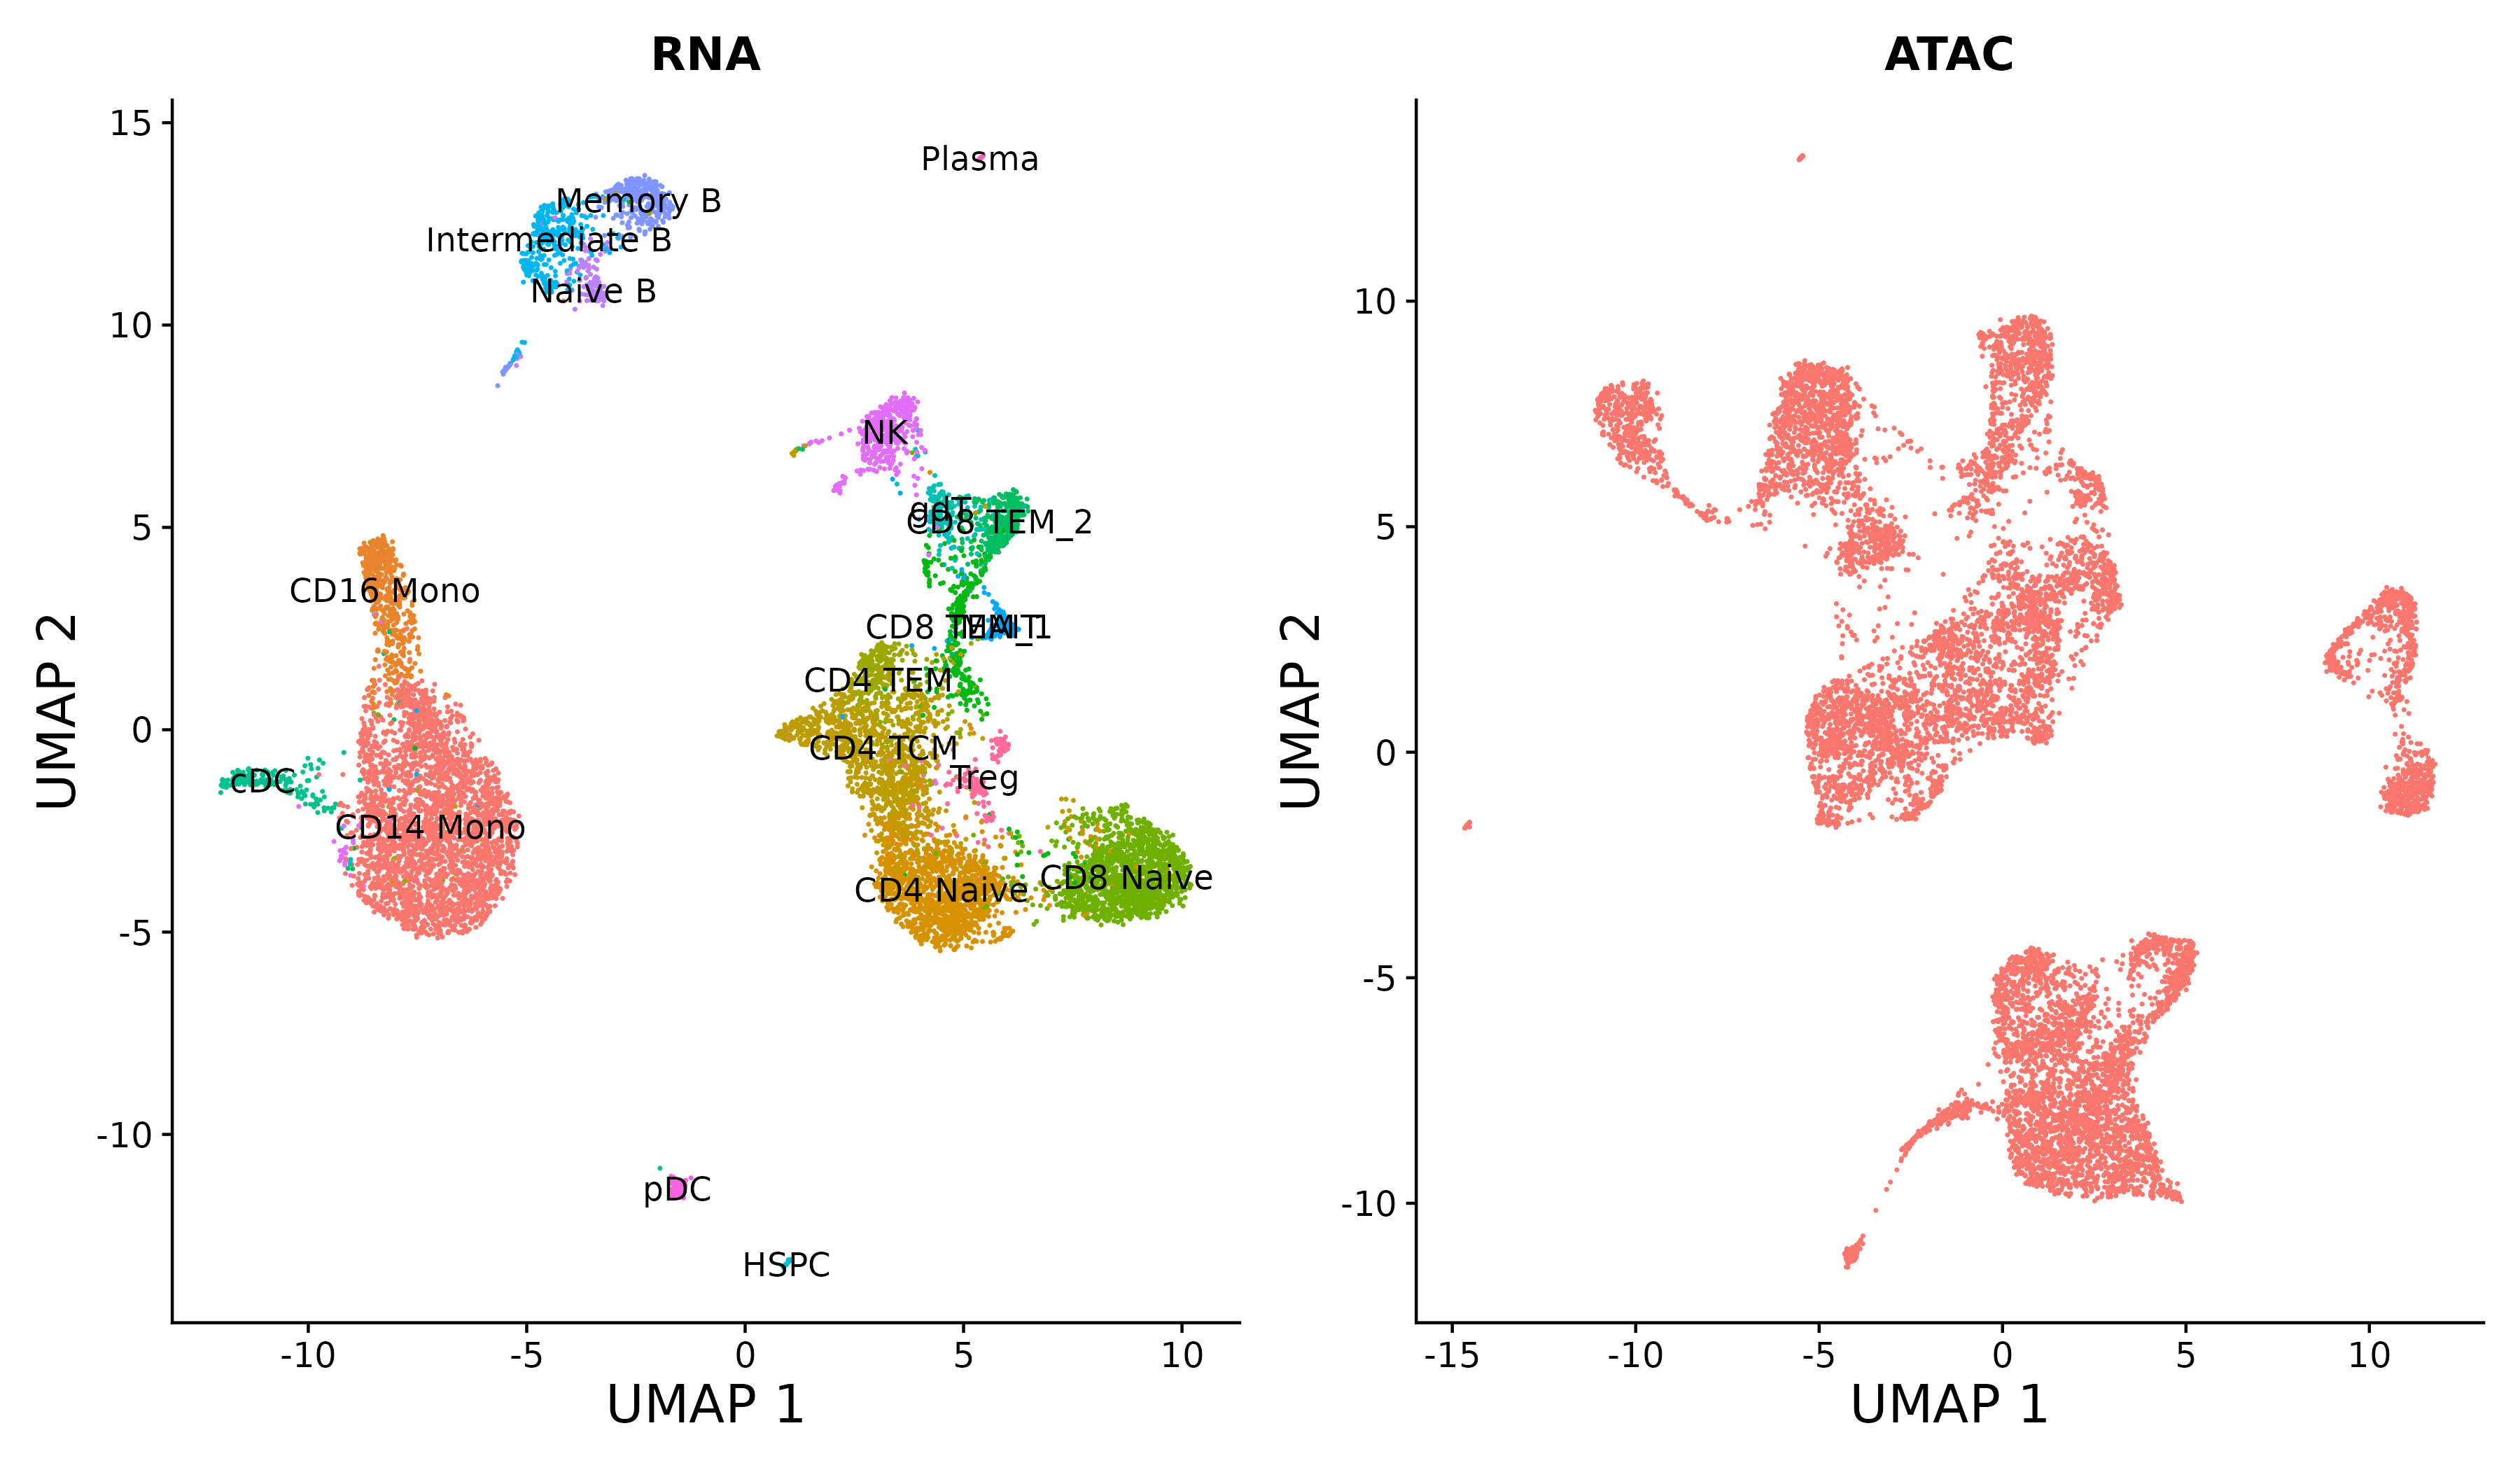
|
| Map scATAC-seq onto an scRNA-seq reference using a multi-omic bridge dataset in Seurat v5. | Analyze multimodal single-cell data with weighted nearest neighbor analysis in Seurat v4. | Annotate, visualize, and interpret an scATAC-seq experiment using scRNA-seq data from the same biological system in Seurat v3. |
| GO | GO | GO |
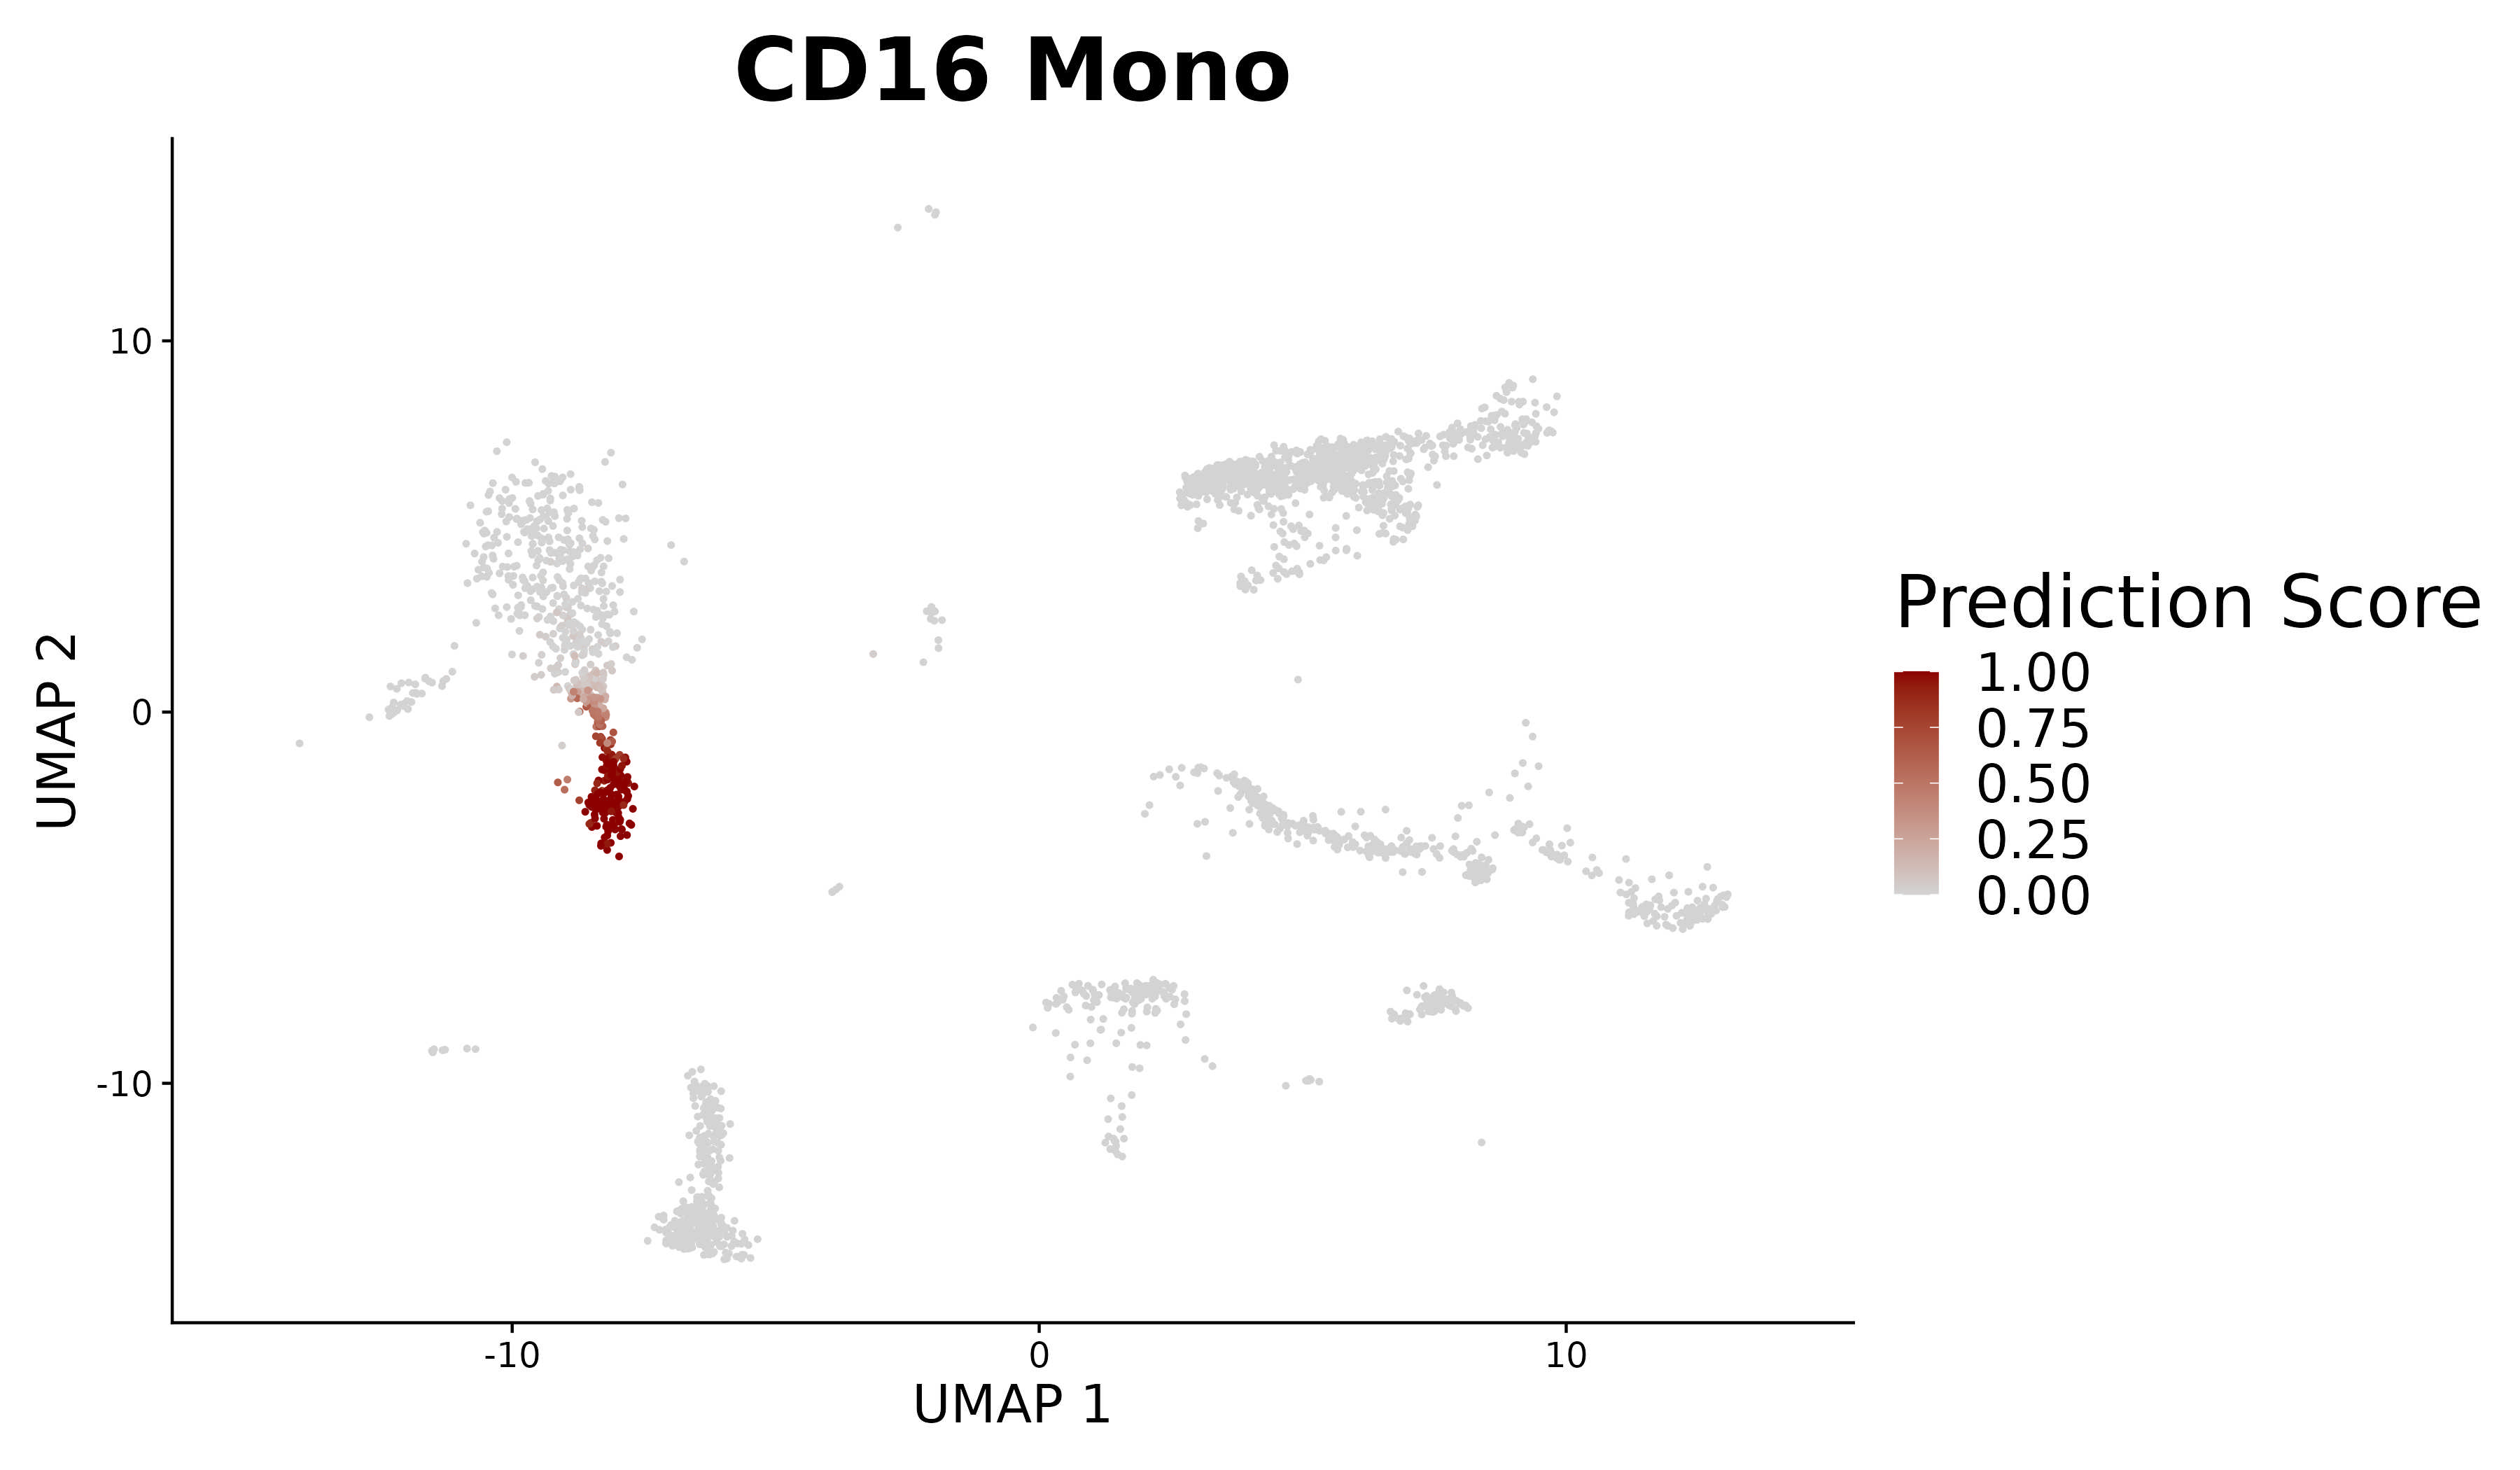
|
|
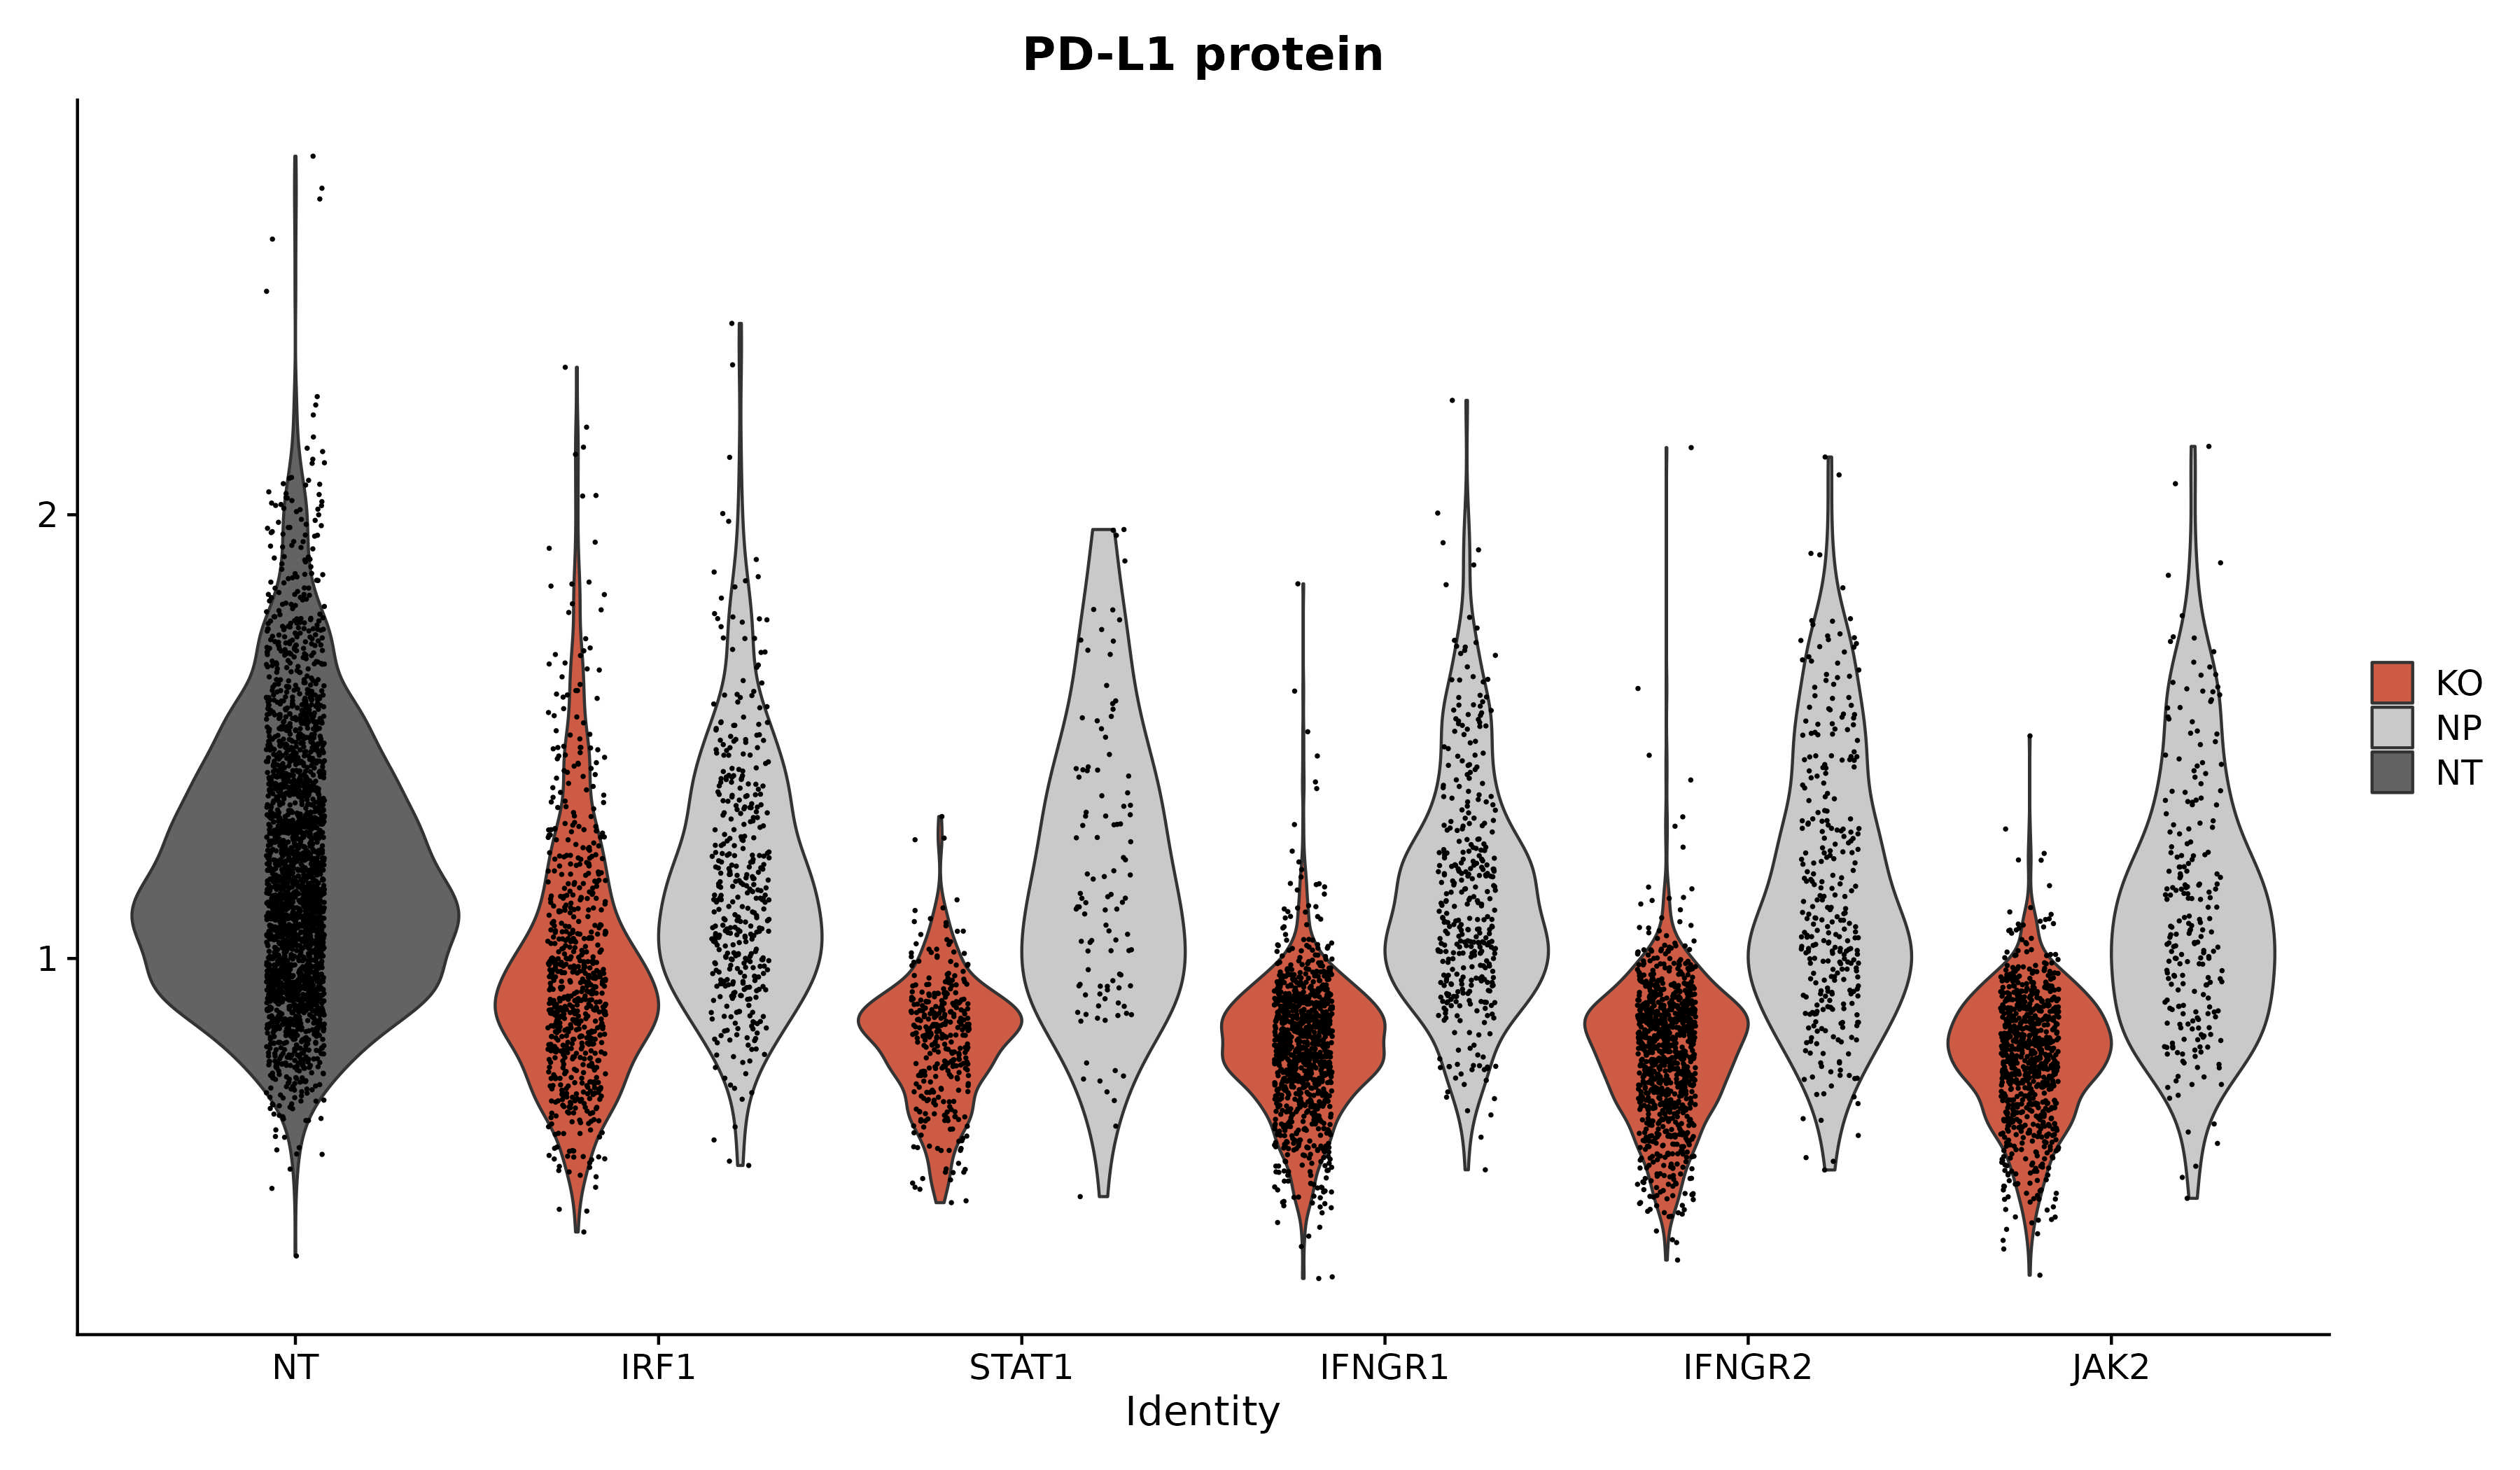
| Analyze query data in the context of multimodal reference atlases. | Explore new methods to analyze pooled single-celled perturbation screens. |
| GO | GO |
Flexible analysis of massively scalable datasets
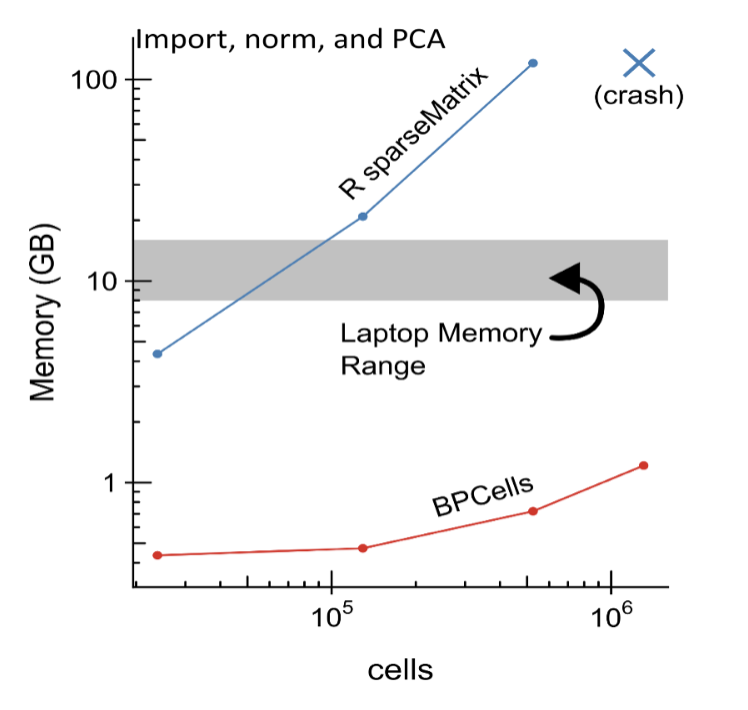
In Seurat v5, we introduce new infrastructure and methods to analyze, interpret, and explore datasets that extend to millions of cells. We introduce support for ‘sketch-based’ techniques, where a subset of representative cells are stored in memory to enable rapid and iterative exploration, while the remaining cells are stored on-disk. Users can flexibly switch between both data representations, and we leverage the BPCells package from Ben Parks in the Greenleaf lab to enable high-performance analysis of disk-backed data.
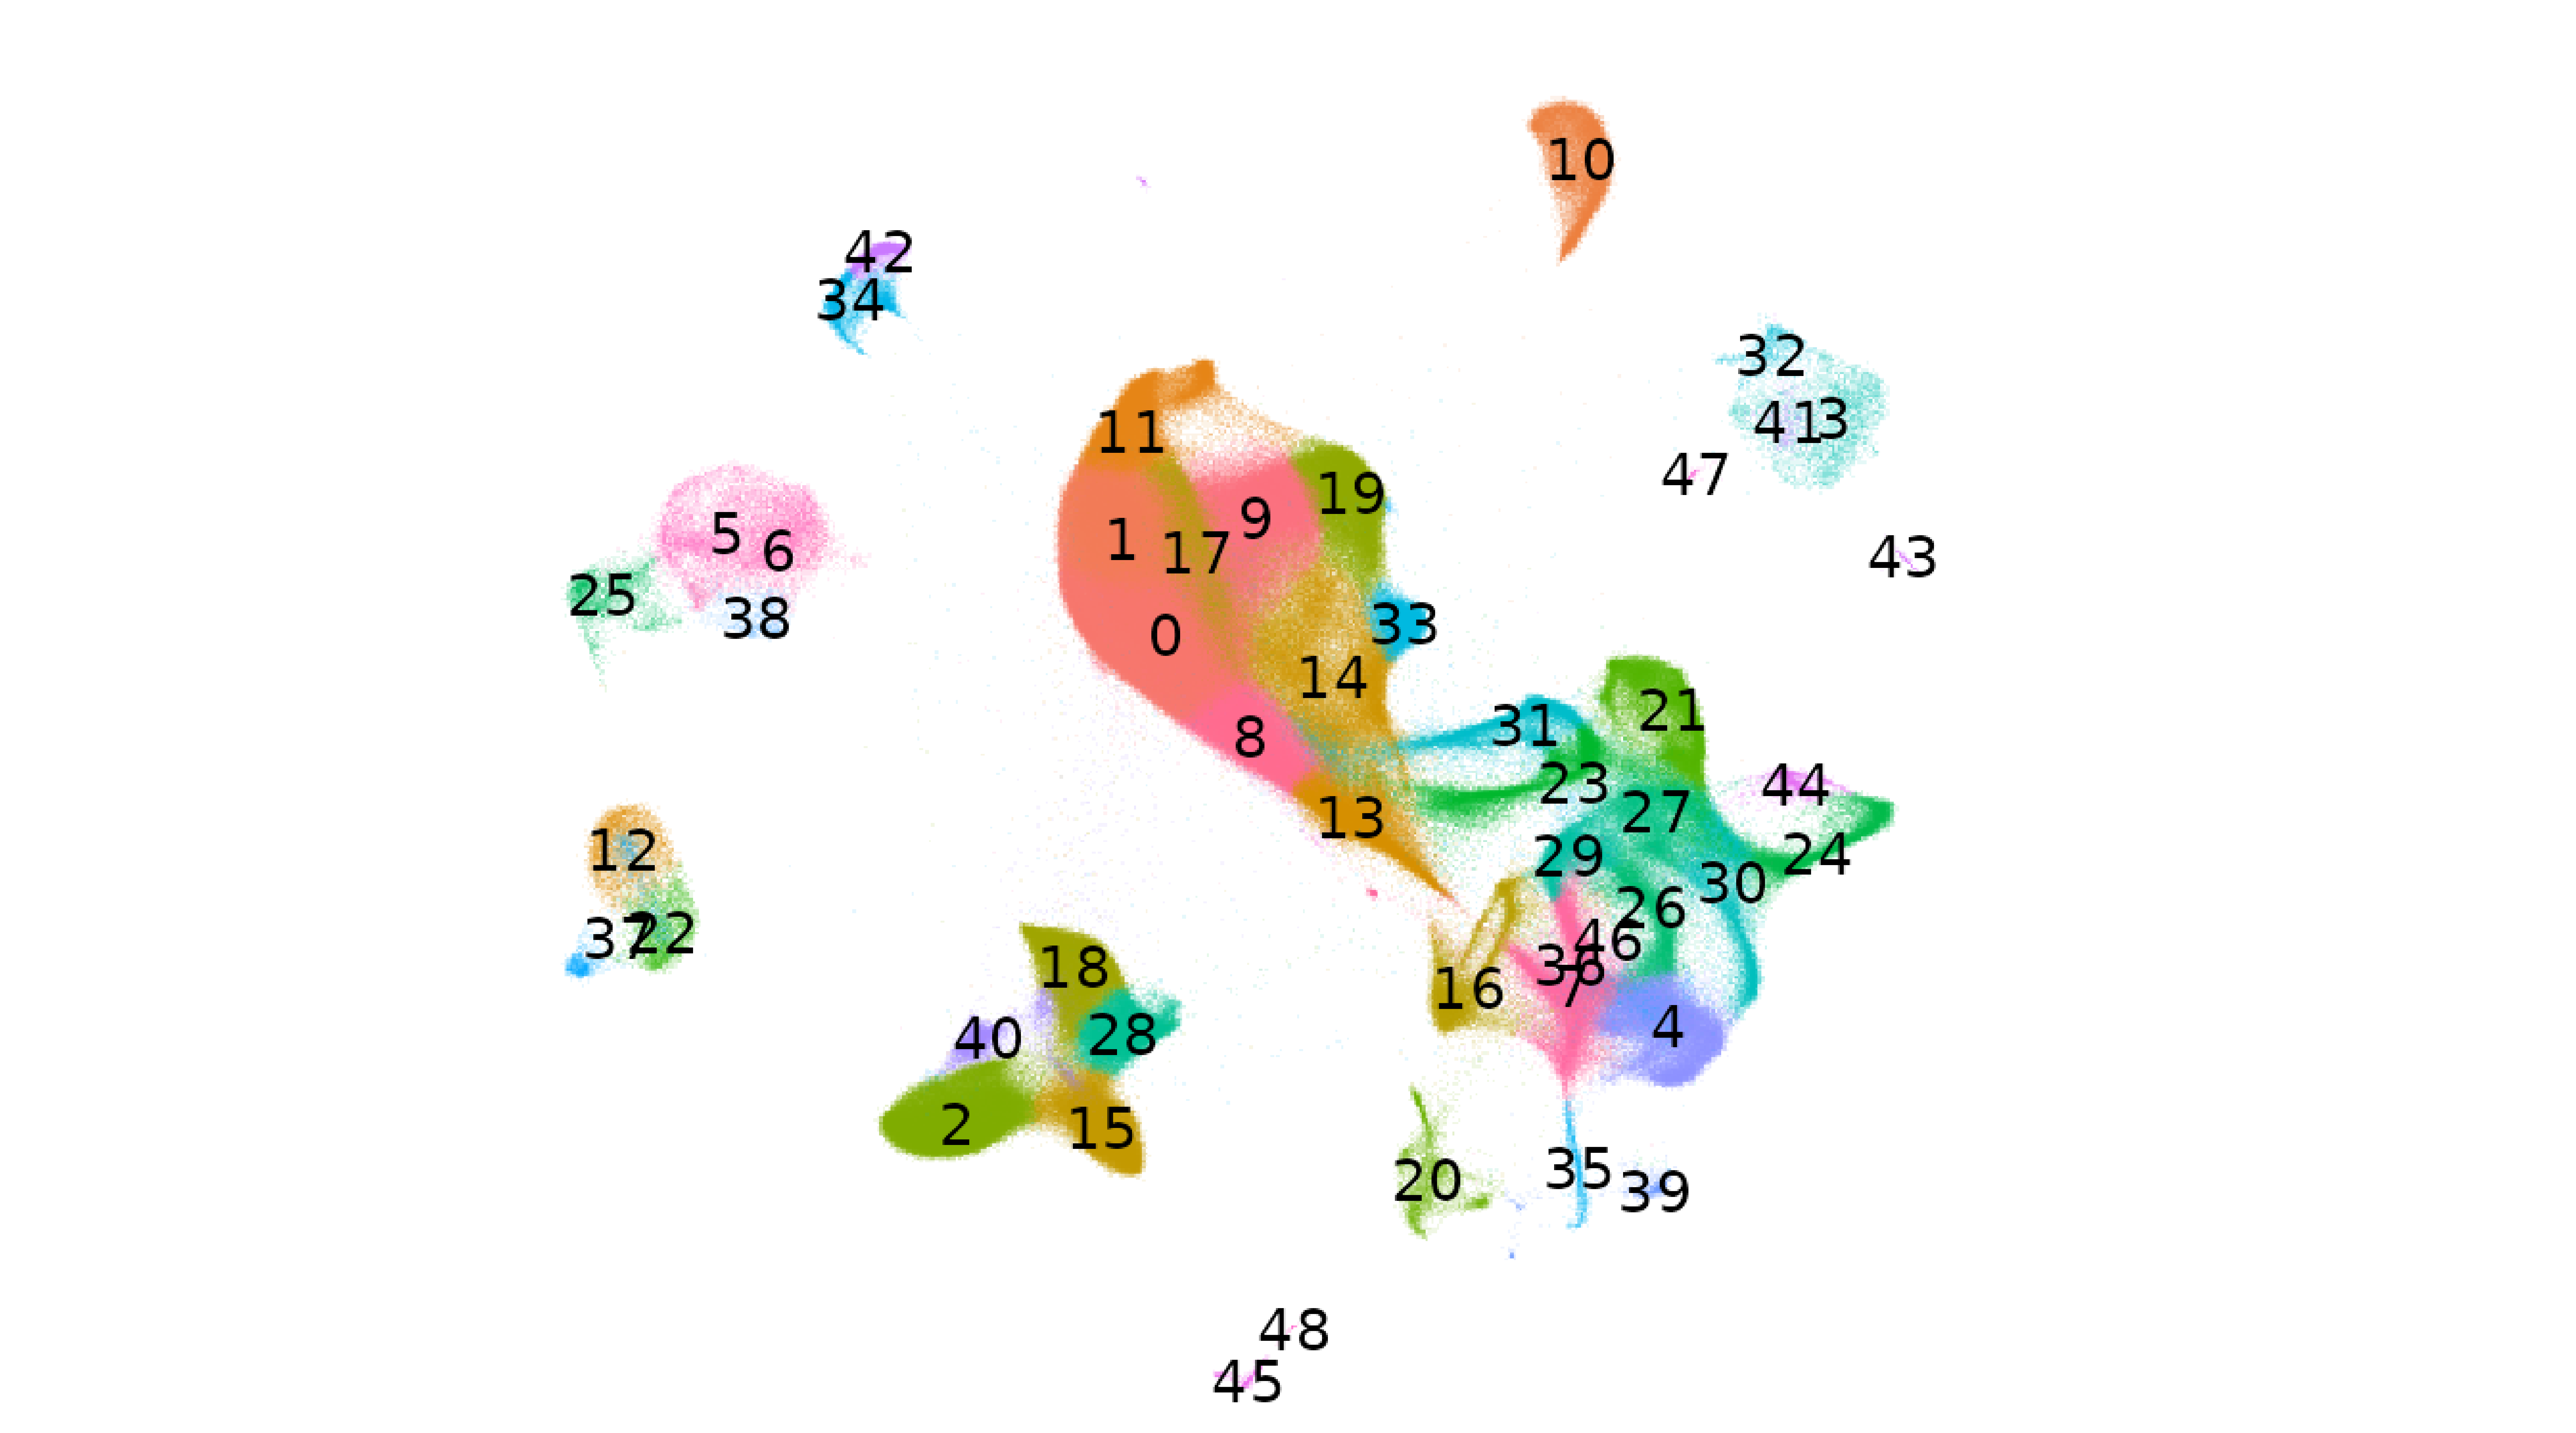
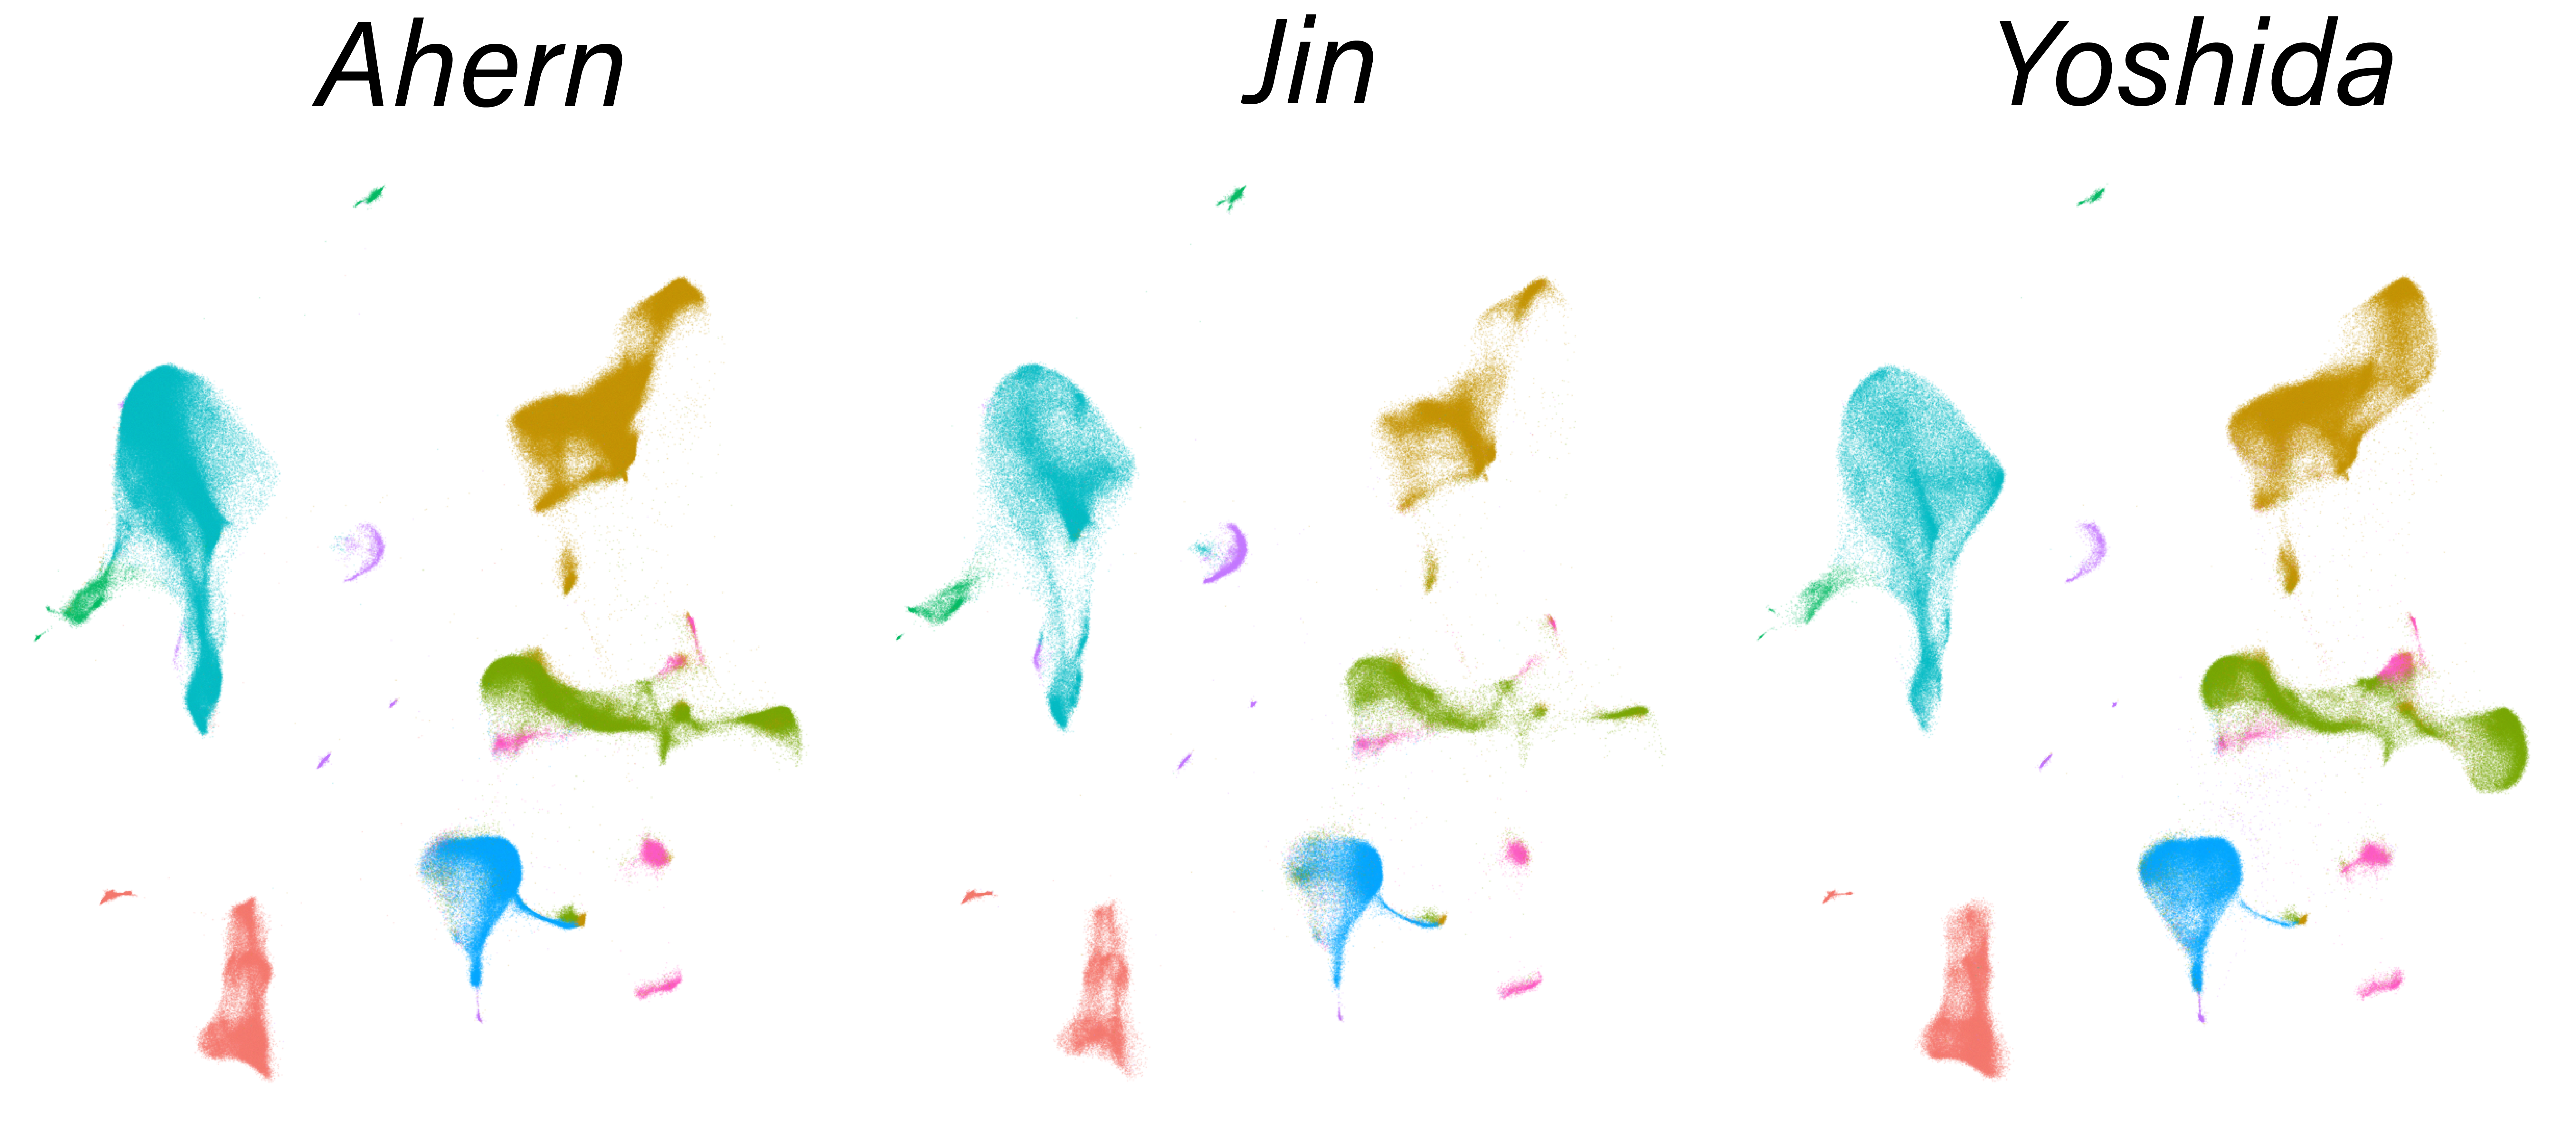
The vignettes below demonstrate three scalable analyses in Seurat v5: Unsupervised clustering analysis of a large dataset (1.3M neurons), Unsupervised integration and comparison of 1M PBMC from healthy and diabetic patients, and Supervised mapping of 1.5M immune cells from healthy and COVID donors. In all cases, the vignettes perform these analyses without ever loading the full datasets into memory.
|

|
|
| Analyze a 1.3 million cell mouse brain dataset using on-disk capabilities powered by BPCells. | Perform sketch integration on a large dataset from Parse Biosciences. | Map PBMC datasets from COVID-19 patients to a healthy PBMC reference. |
| GO | GO | GO |
|
| Load and save large on-disk matrices using BPCells. |
| GO |
Spatial analysis
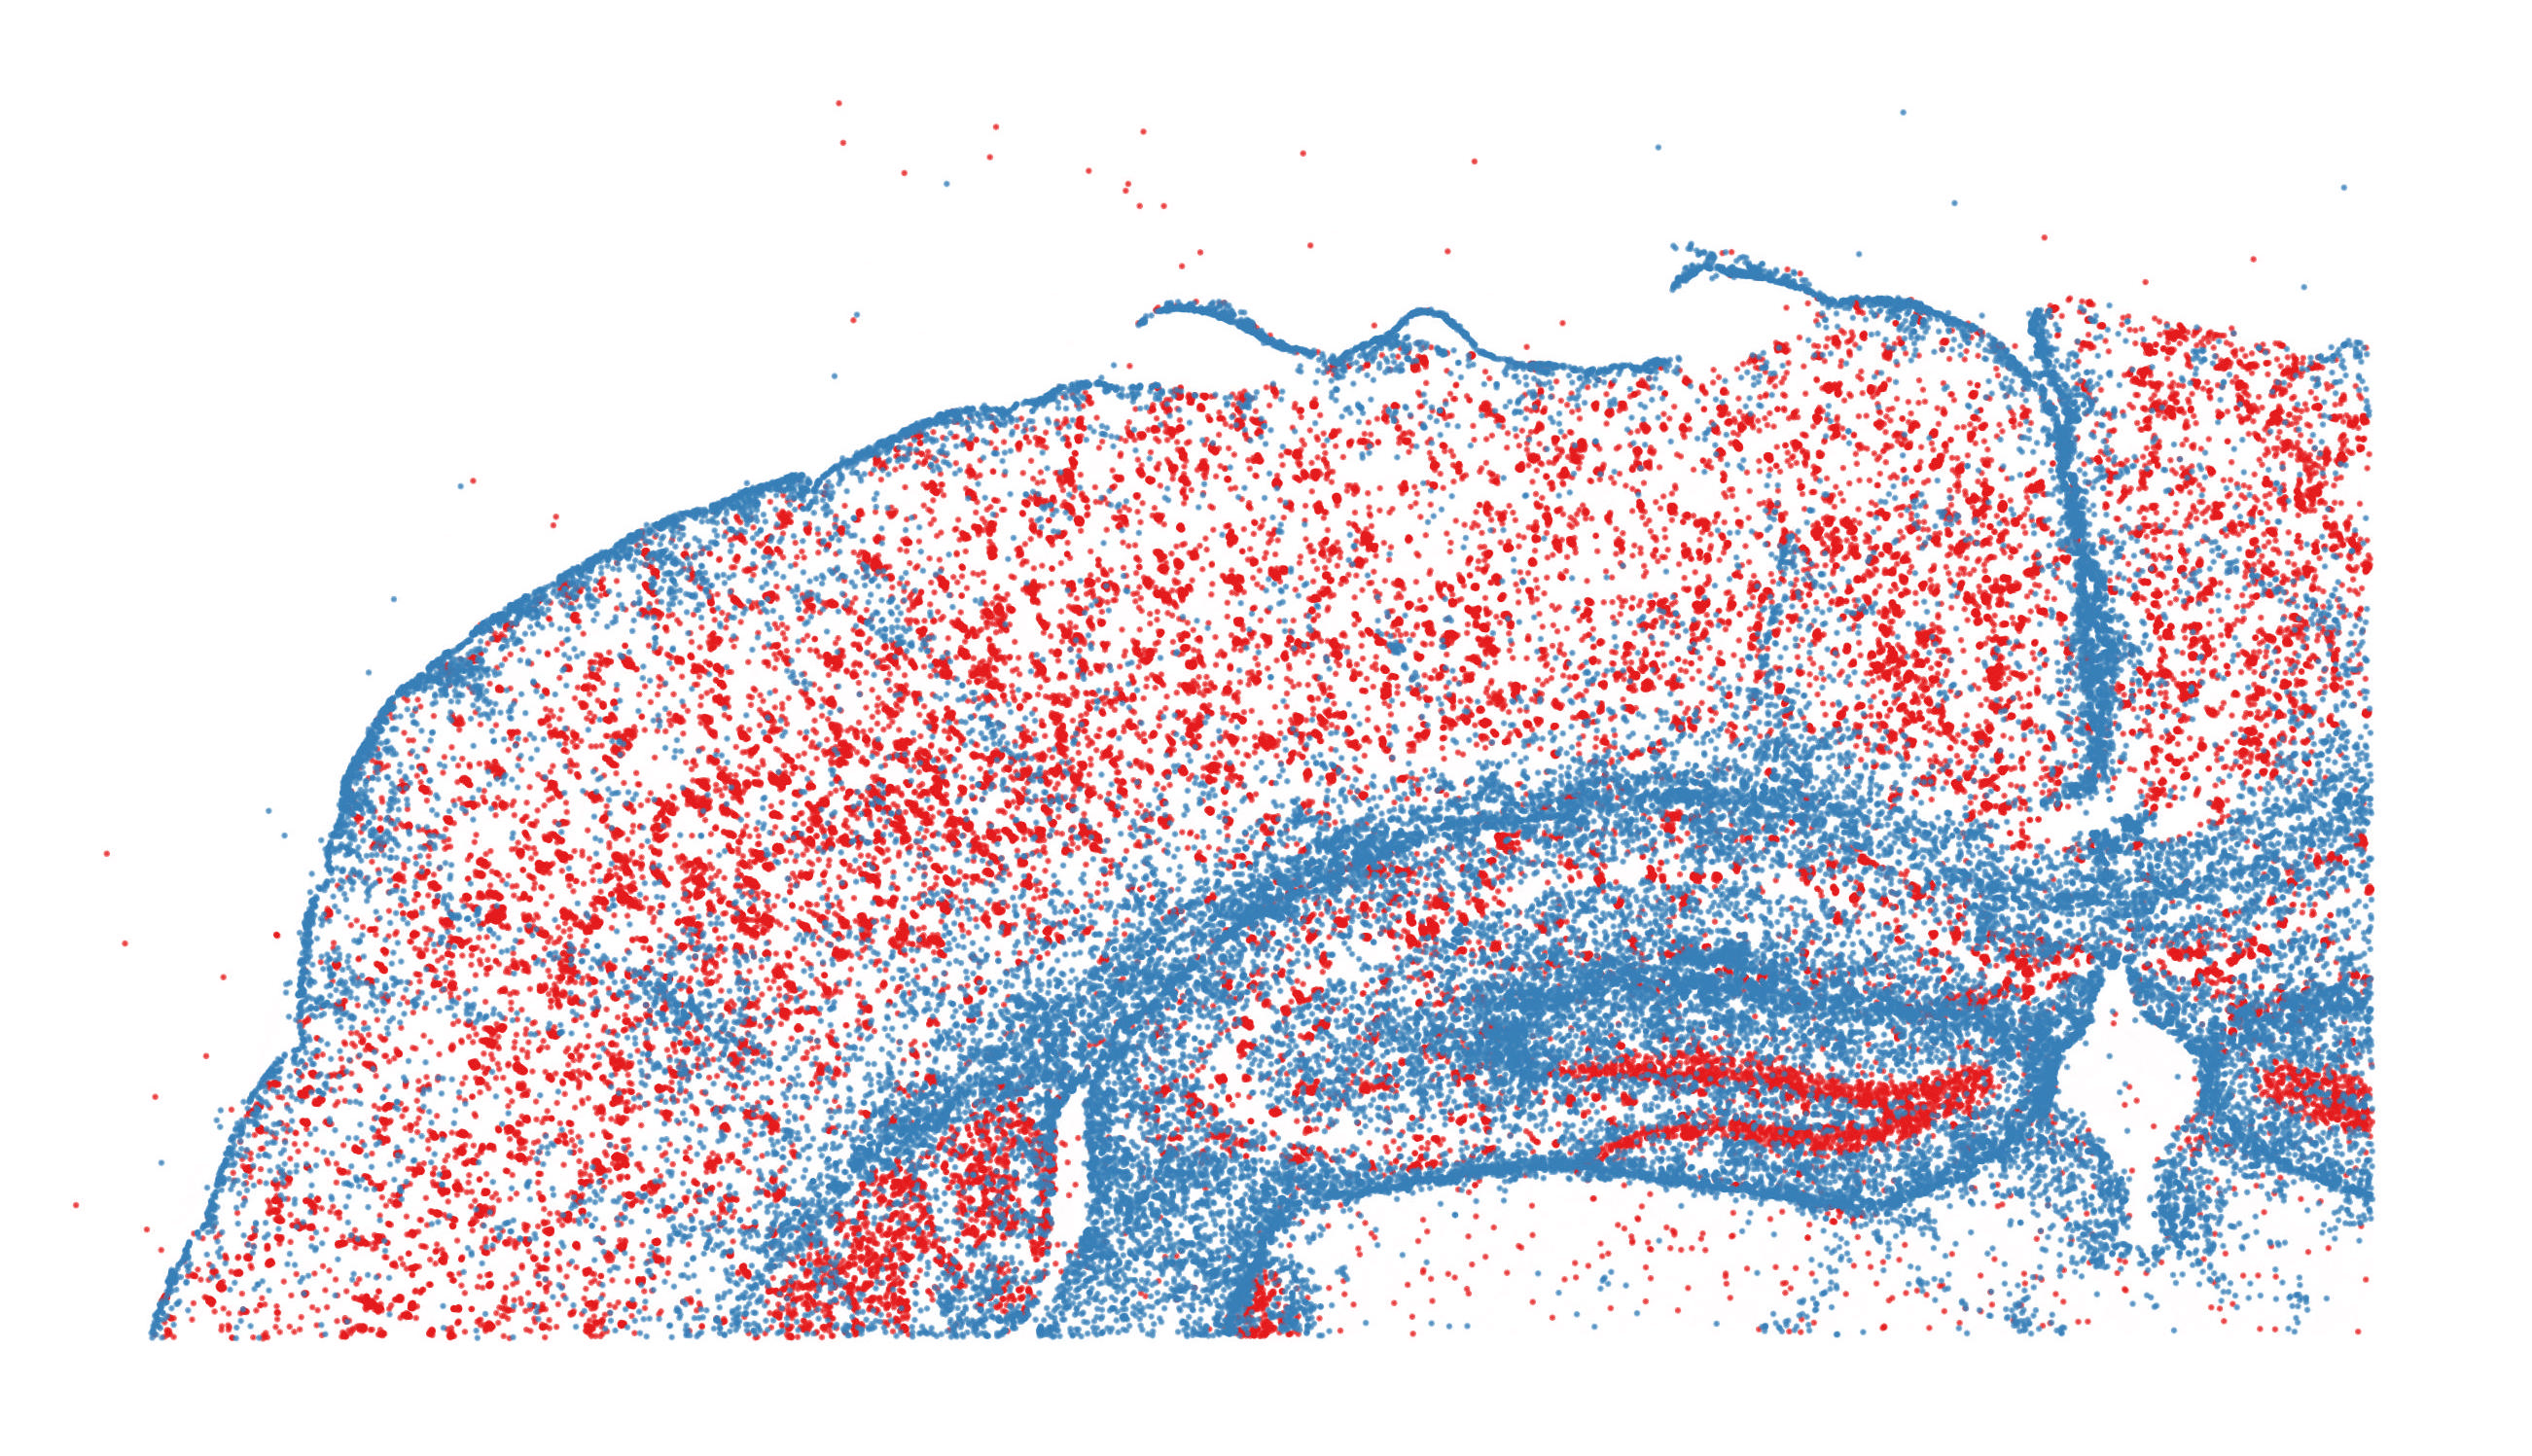
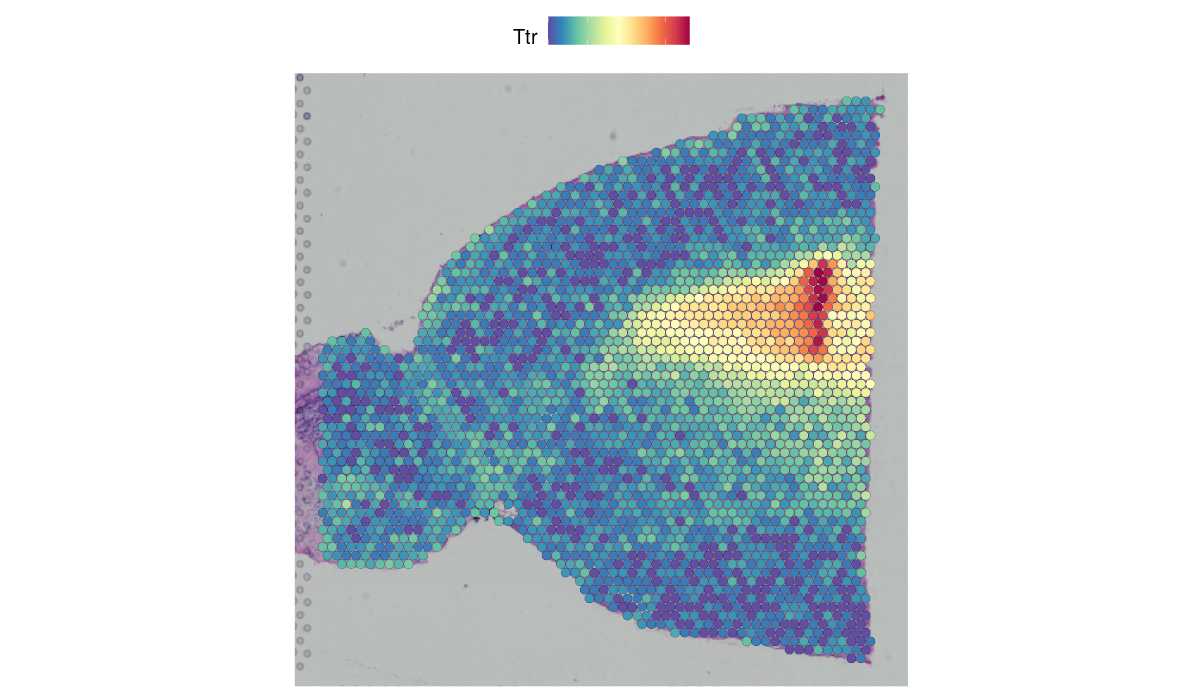
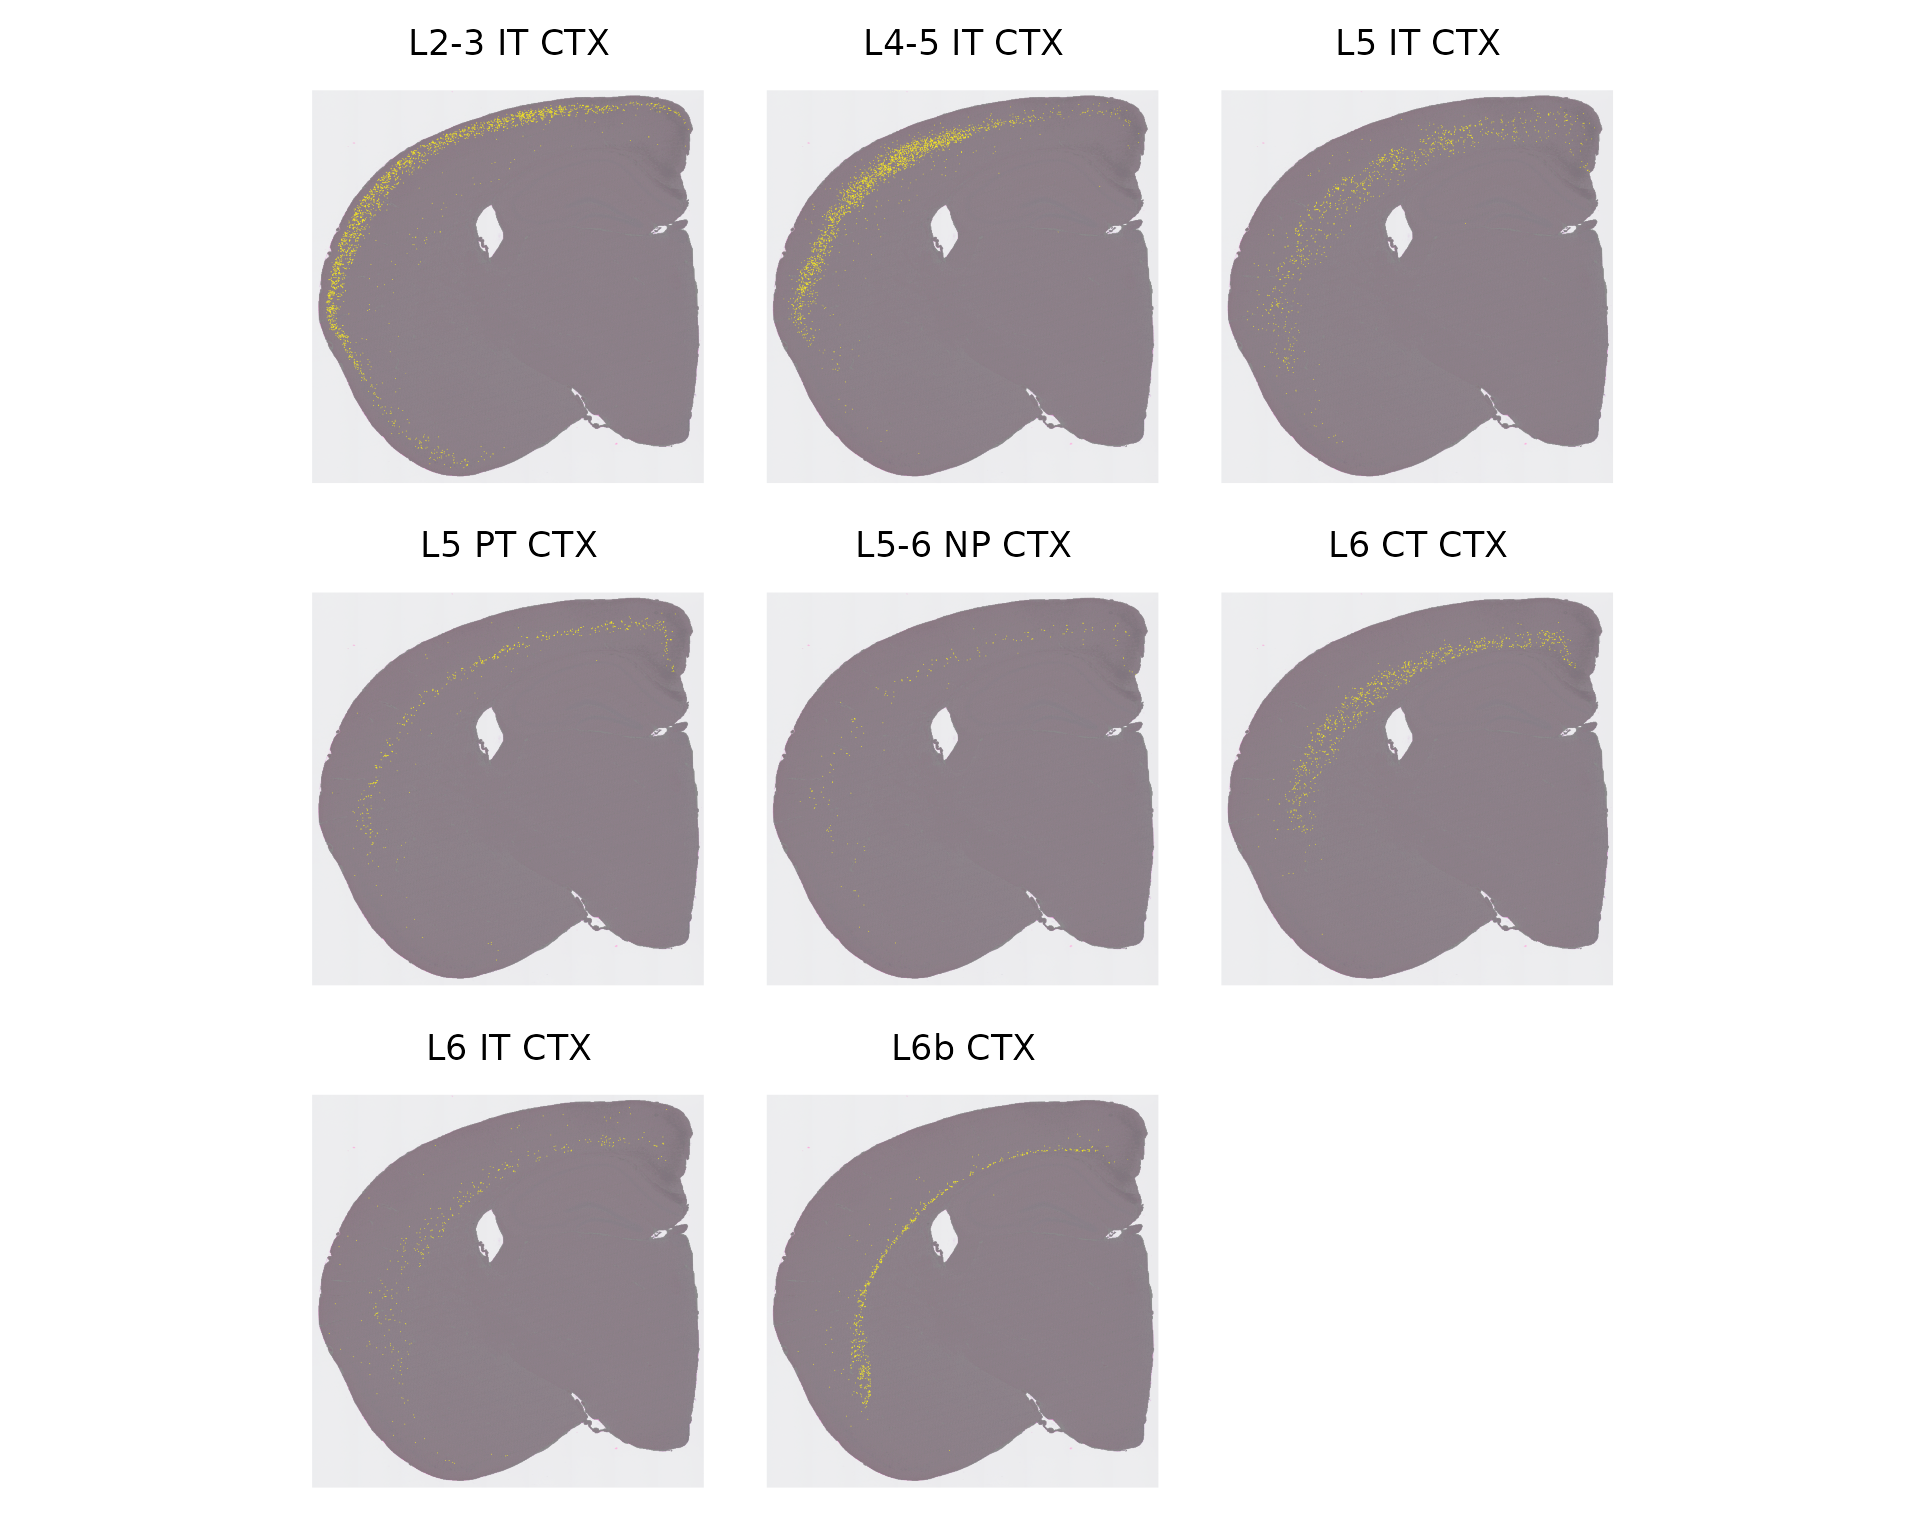
These vignettes will help introduce users to the analysis of spatial datasets in Seurat v5, including technologies that leverage sequencing-based readouts, as well as technologies that leverage in-situ imaging-based readouts. The vignettes introduce data from multiple platforms including 10x Visium, SLIDE-seq, Vizgen MERSCOPE, 10x Xenium, Nanostring CosMx, and Akoya CODEX.
|
|
|
| Learn to explore spatially-resolved data from multiplexed imaging technologies, including MERSCOPE, Xenium, CosMx SMI, and CODEX. | Learn to explore spatially-resolved transcriptomic data with examples from 10x Visium and Slide-seq v2. | Learn to explore spatially-resolved transcriptomic data in high-definition from 10x Visium HD. |
| GO | GO | GO |
Other
Here we provide a series of short vignettes to demonstrate a number of features that are commonly used in Seurat. We’ve focused the vignettes around questions that we frequently receive from users.
|
|
|
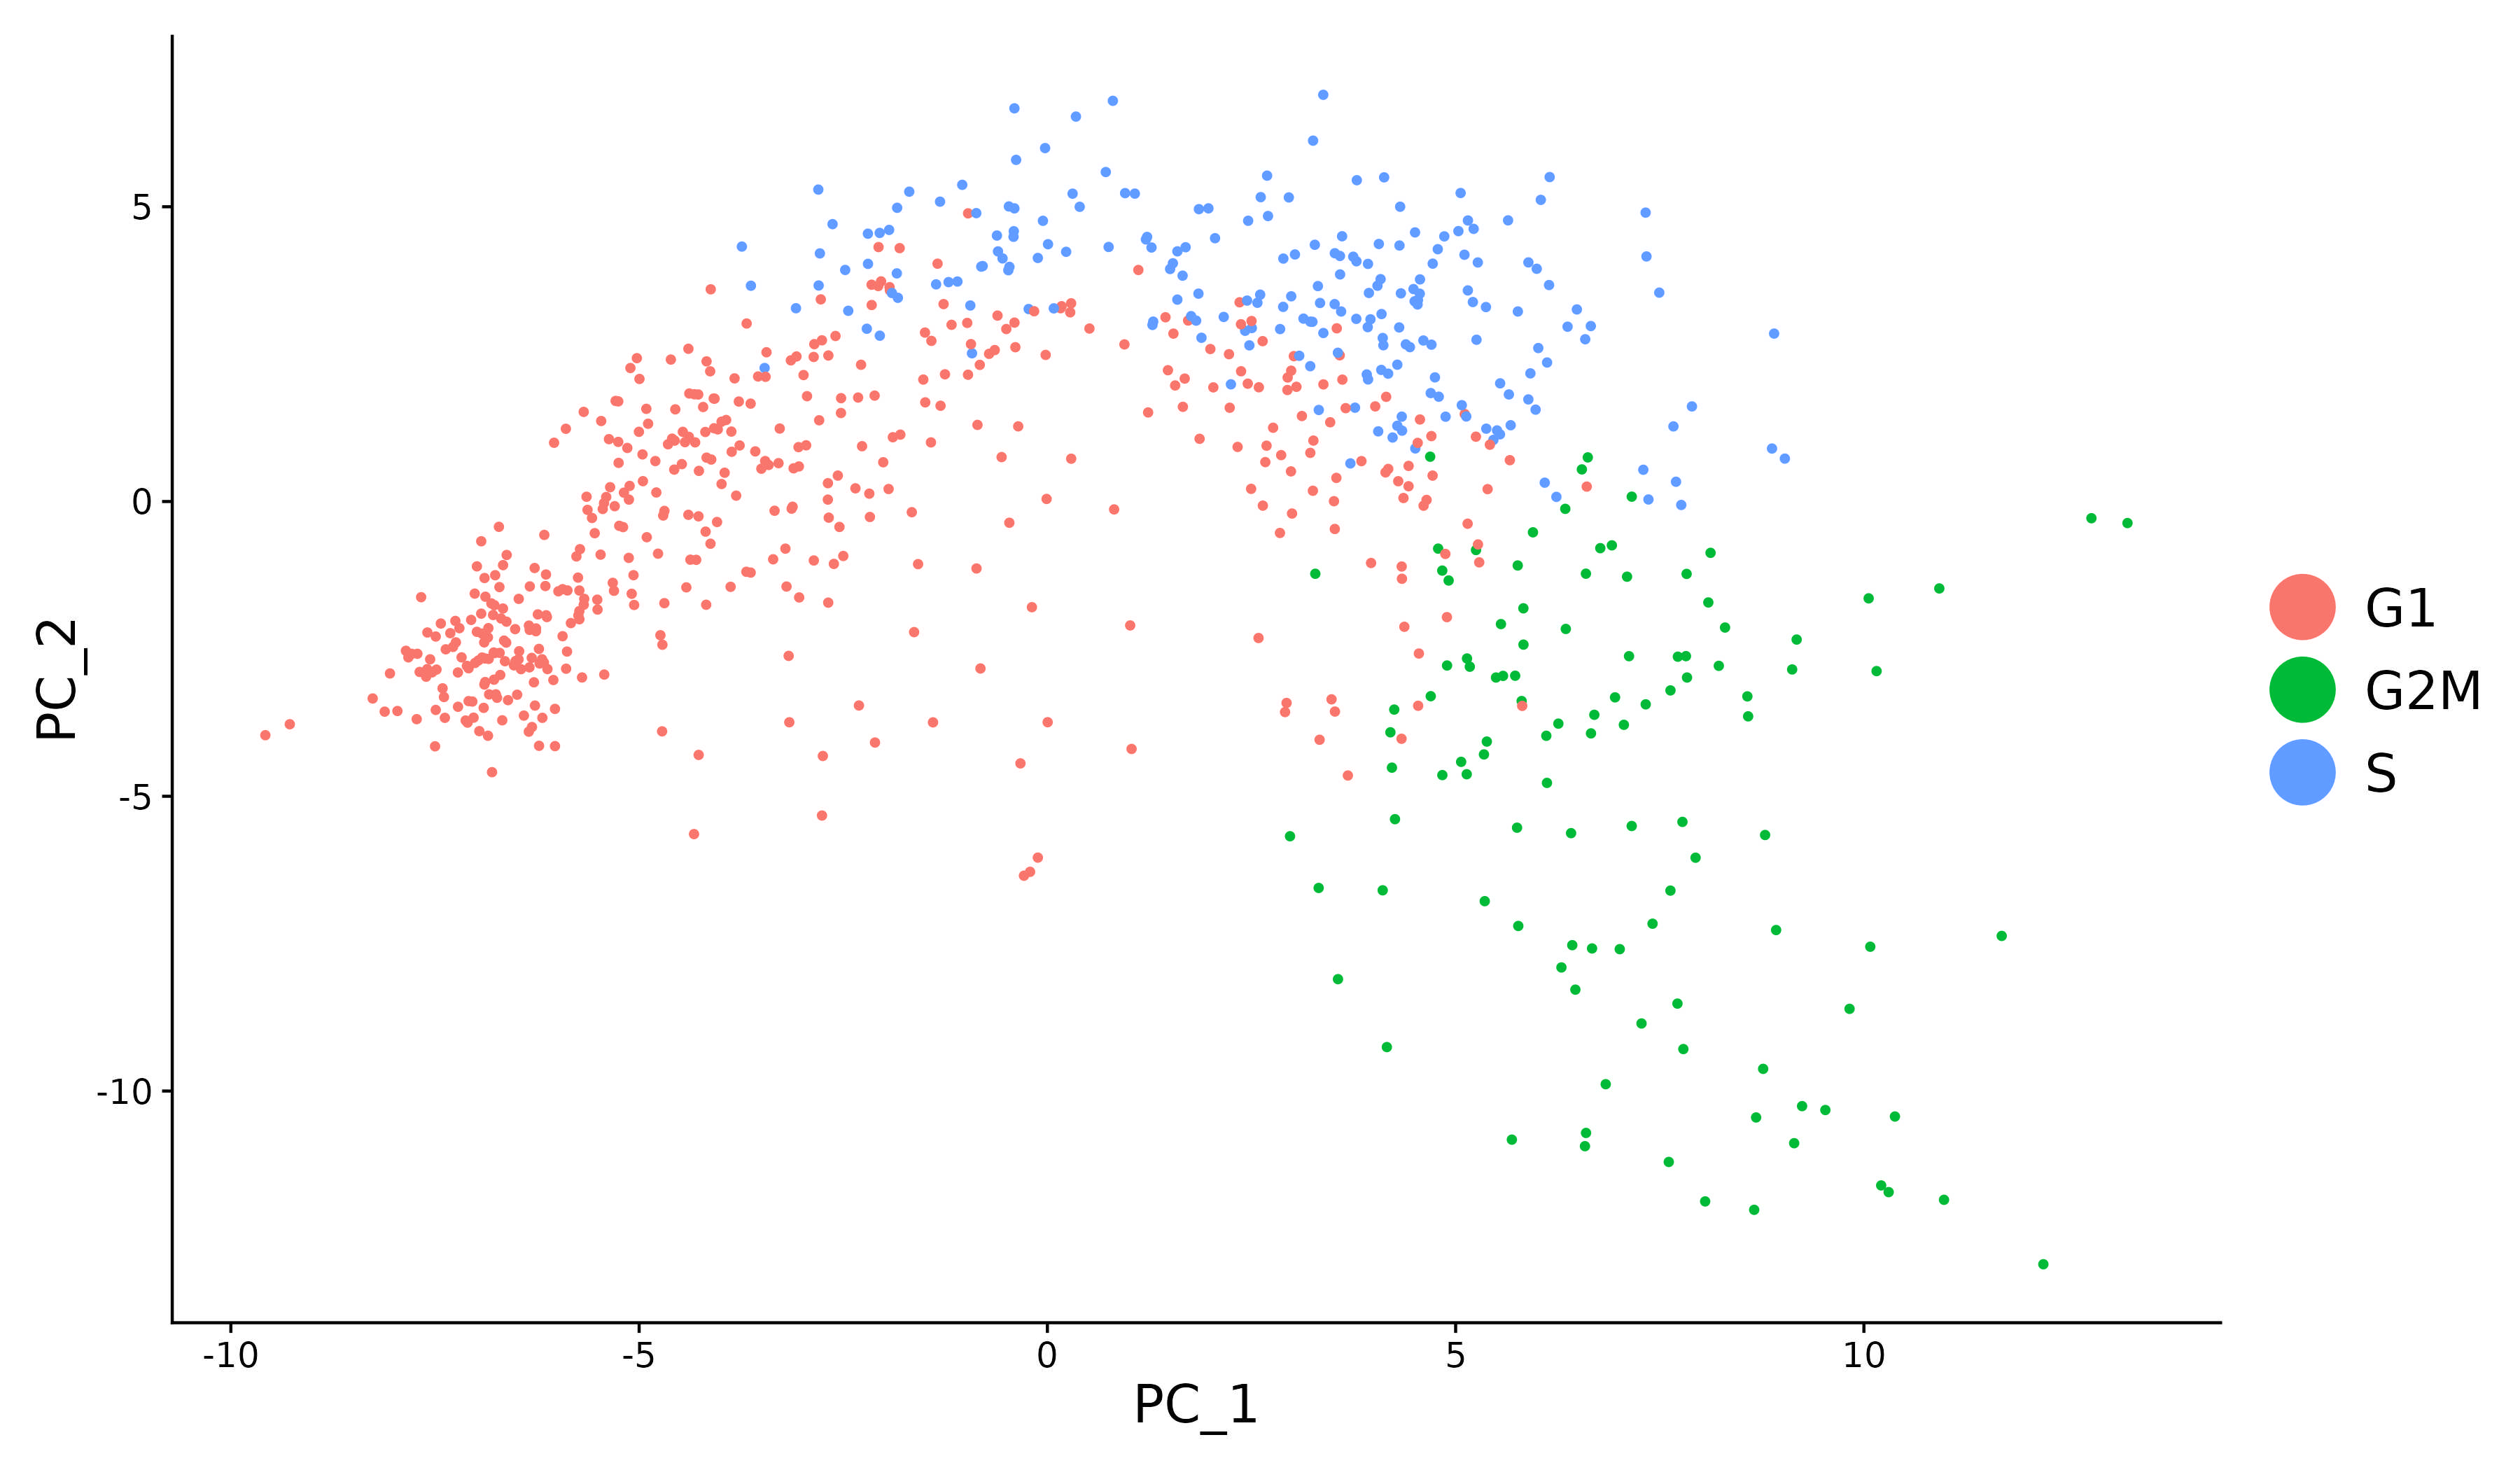
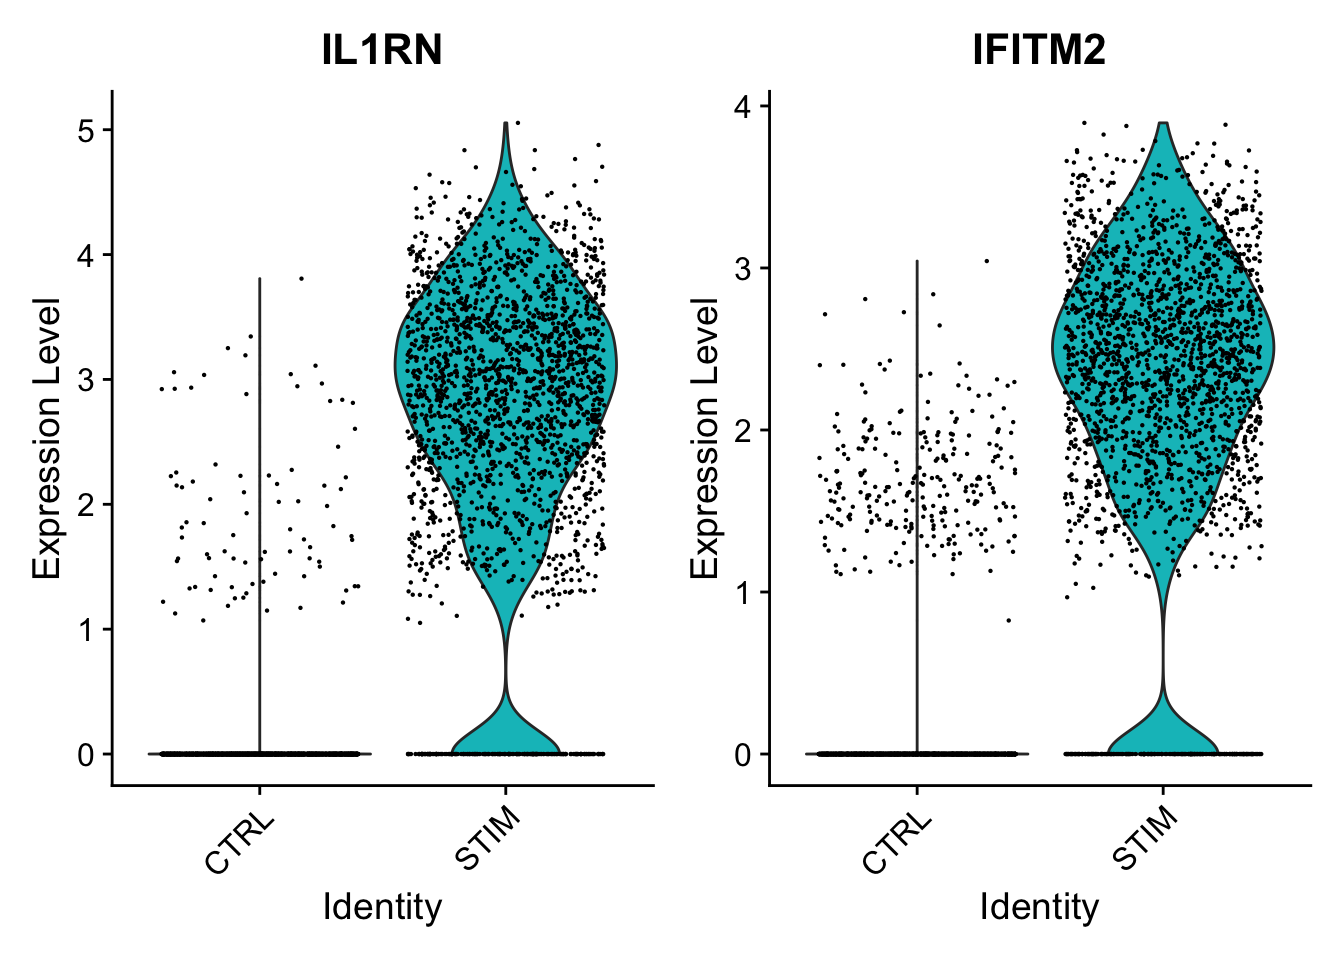
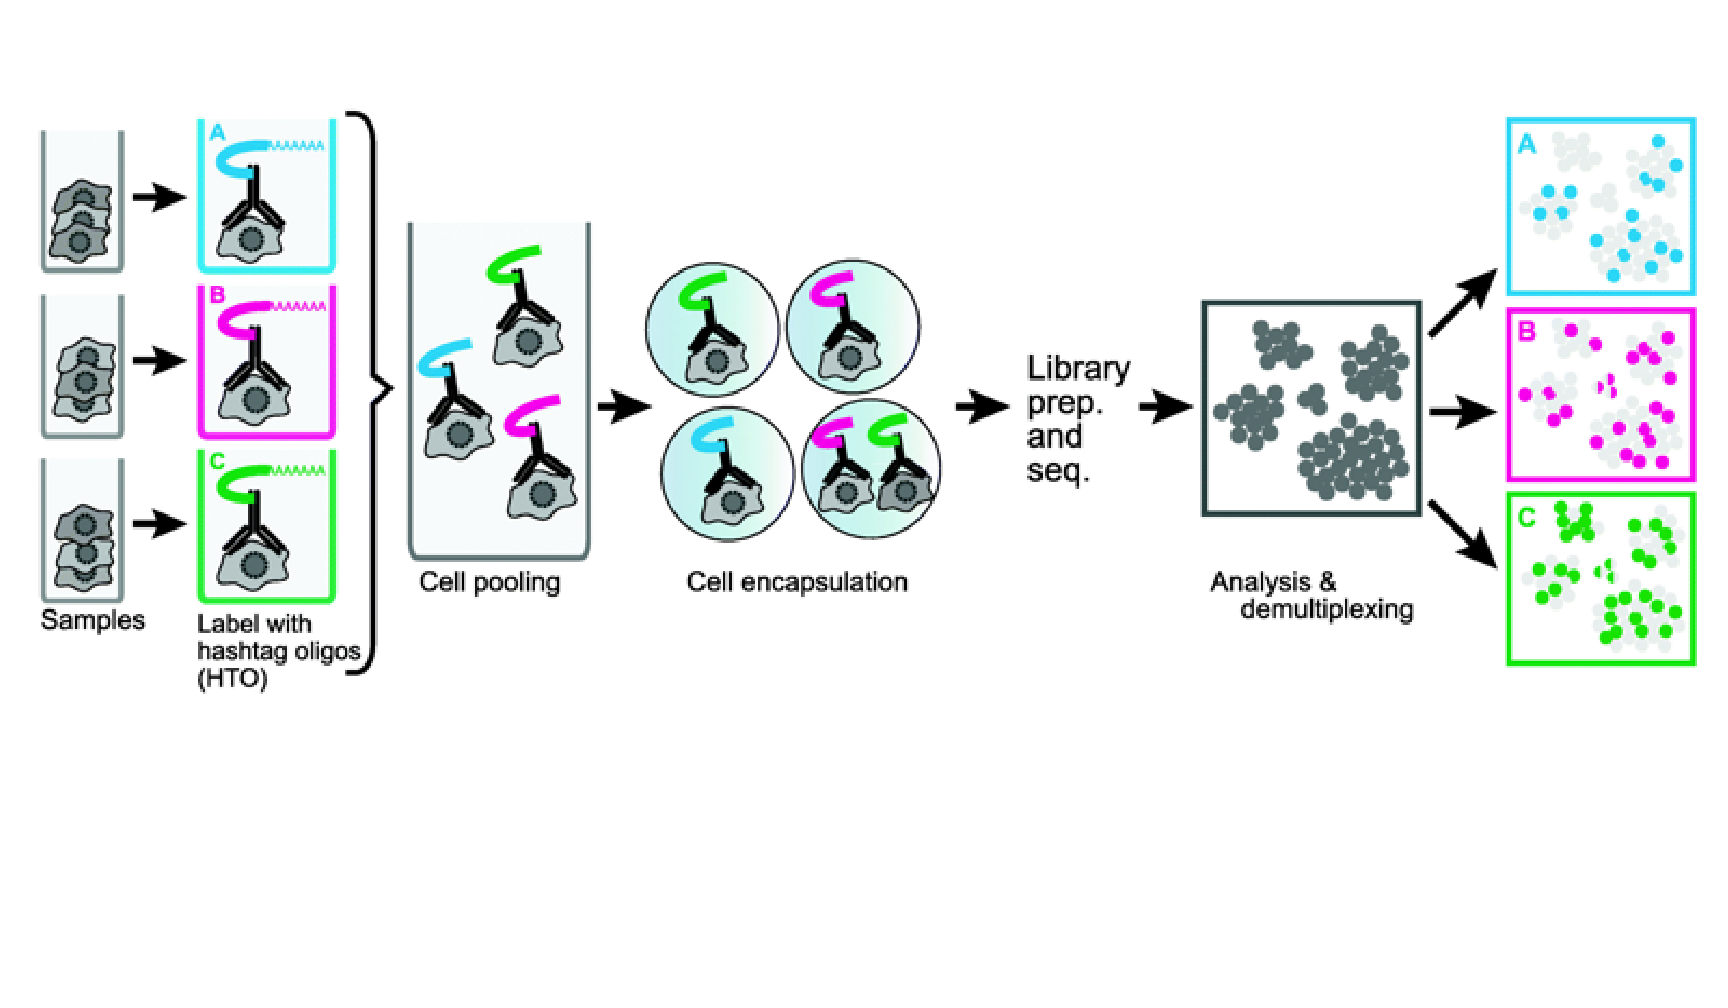
| Mitigate the effects of cell cycle heterogeneity by computing cell cycle phase scores based on marker genes. | Perform differential expression (DE) testing in Seurat using a number of frameworks. | Learn how to work with data produced with Cell Hashing. |
| GO | GO | GO |
SeuratWrappers
In order to facilitate the use of community tools with Seurat, we provide the Seurat Wrappers package, which contains code to run other analysis tools on Seurat objects. For the initial release, we provide wrappers for a few packages in the table below but would encourage other package developers interested in interfacing with Seurat to check out our contributor guide here.