Draws a violin plot of single cell data (gene expression, metrics, PC scores, etc.)
VlnPlot(
  object,
  features,
  cols = NULL,
  pt.size = NULL,
  alpha = 1,
  idents = NULL,
  sort = FALSE,
  assay = NULL,
  group.by = NULL,
  split.by = NULL,
  adjust = 1,
  y.max = NULL,
  same.y.lims = FALSE,
  log = FALSE,
  ncol = NULL,
  slot = deprecated(),
  layer = NULL,
  split.plot = FALSE,
  stack = FALSE,
  combine = TRUE,
  fill.by = "feature",
  flip = FALSE,
  add.noise = TRUE,
  raster = NULL,
  raster.dpi = 300
)
Arguments
- object
Seurat object
- features
Features to plot (gene expression, metrics, PC scores, anything that can be retreived by FetchData)
- cols
Colors to use for plotting
- pt.size
Point size for points
- alpha
Alpha value for points
- idents
Which classes to include in the plot (default is all)
- sort
Sort identity classes (on the x-axis) by the average expression of the attribute being potted, can also pass 'increasing' or 'decreasing' to change sort direction
- assay
Name of assay to use, defaults to the active assay
- group.by
Group (color) cells in different ways (for example, orig.ident)
- split.by
A factor in object metadata to split the plot by, pass 'ident' to split by cell identity
- adjust
Adjust parameter for geom_violin
- y.max
Maximum y axis value
- same.y.lims
Set all the y-axis limits to the same values
- log
plot the feature axis on log scale
- ncol
Number of columns if multiple plots are displayed
- slot
Slot to pull expression data from (e.g. "counts" or "data")
- layer
Layer to pull expression data from (e.g. "counts" or "data")
- split.plot
plot each group of the split violin plots by multiple or single violin shapes.
- stack
Horizontally stack plots for each feature
- combine
Combine plots into a single
patchworkedggplot object. IfFALSE, return a list of ggplot- fill.by
Color violins/ridges based on either 'feature' or 'ident'
- flip
flip plot orientation (identities on x-axis)
- add.noise
determine if adding a small noise for plotting
- raster
Convert points to raster format. Requires 'ggrastr' to be installed.
- raster.dpi
the dpi for raster layer, default is 300. See
rasterizefor more info.
Value
A patchworked ggplot object if
combine = TRUE; otherwise, a list of ggplot objects
See also
Examples
data("pbmc_small")
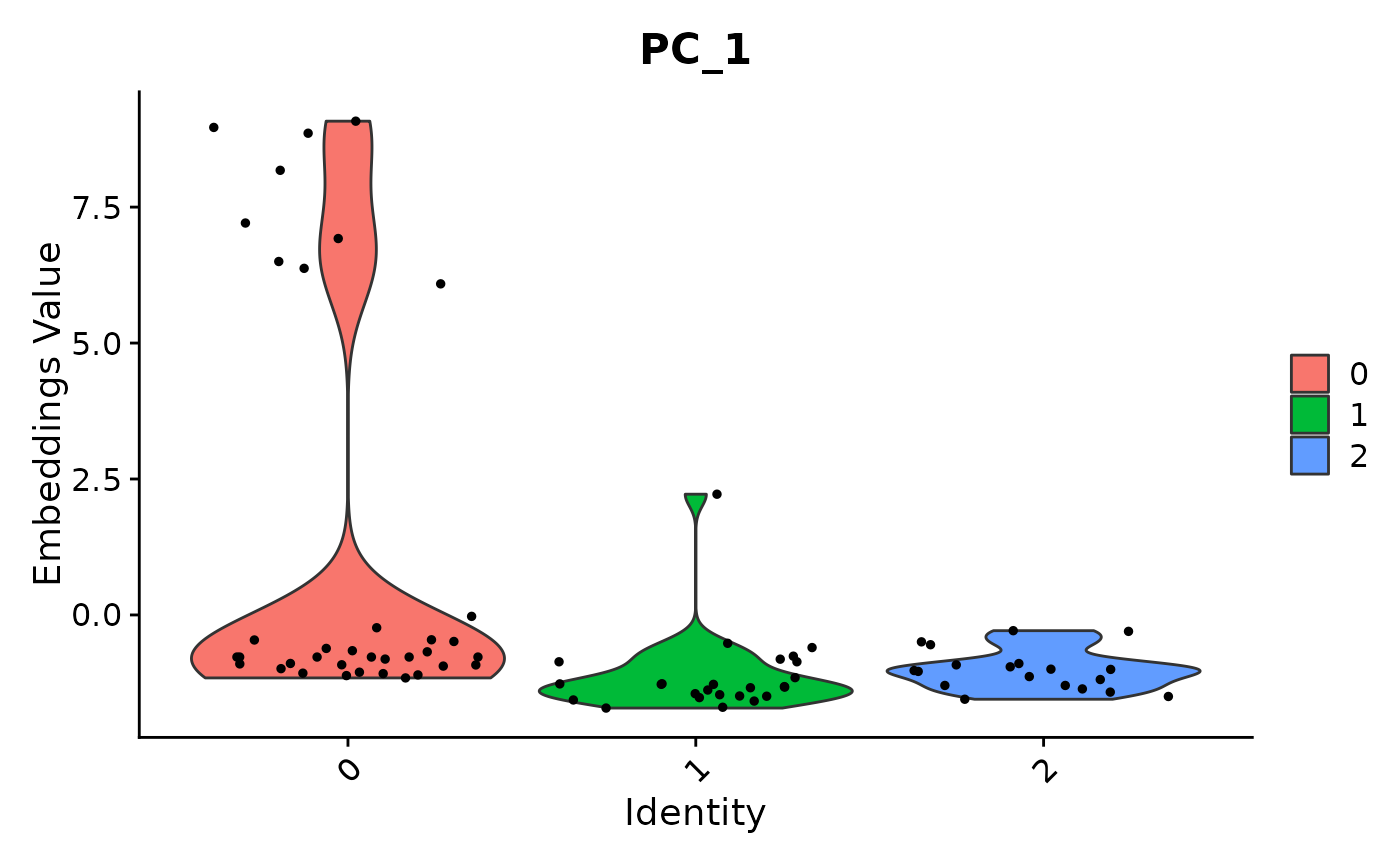
VlnPlot(object = pbmc_small, features = 'PC_1')
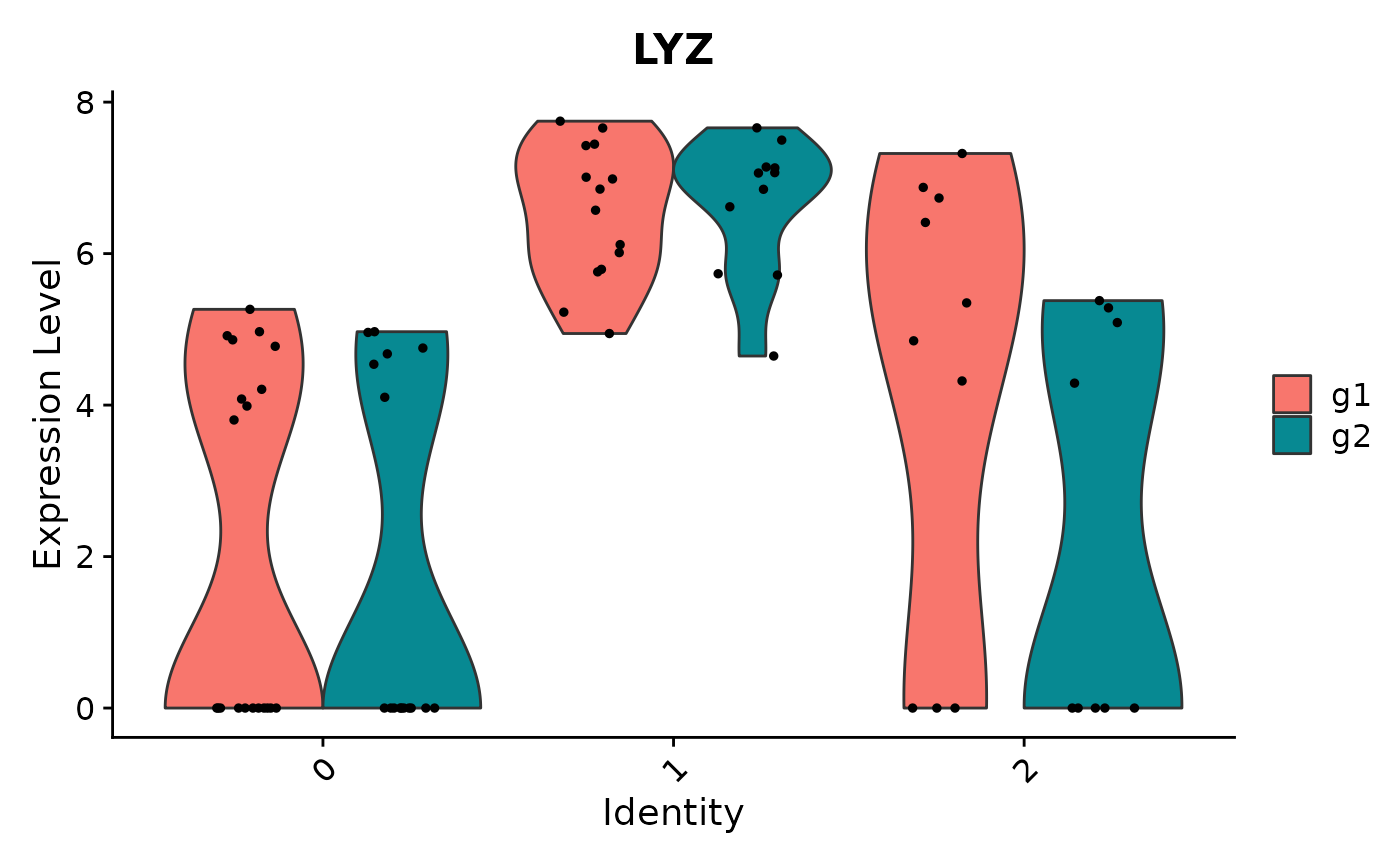
 VlnPlot(object = pbmc_small, features = 'LYZ', split.by = 'groups')
#> The default behaviour of split.by has changed.
#> Separate violin plots are now plotted side-by-side.
#> To restore the old behaviour of a single split violin,
#> set split.plot = TRUE.
#>
#> This message will be shown once per session.
VlnPlot(object = pbmc_small, features = 'LYZ', split.by = 'groups')
#> The default behaviour of split.by has changed.
#> Separate violin plots are now plotted side-by-side.
#> To restore the old behaviour of a single split violin,
#> set split.plot = TRUE.
#>
#> This message will be shown once per session.