Cell type annotation with Pan-human Azimuth
Compiled: November 06, 2026
Source:vignettes/intro_azimuthapi_vignette.Rmd
intro_azimuthapi_vignette.RmdOverview
This vignette demonstrates how to install and use
AzimuthAPI, an interface for cell type annotation using the
Pan-human Azimuth neural network. The API takes a Seurat object and
returns hierarchical cell type predictions, confidence scores, and
low-dimensional embeddings useful for visualization.
For details on the model and its evaluation, see the Pan-human Azimuth pre-print.
Currently, this vignette mirrors our tutorial published on the Pan-human Azimuth website.
Install AzimuthAPI
The Pan-human Azimuth R API, AzimuthAPI, is available
for installation via GitHub:
remotes::install_github("satijalab/AzimuthAPI")Load packages and data
For this vignette, we will demonstrate annotating a dataset of human
bone marrow mononuclear (BMNC) cells that we published as part of Stuart, Butler et al
Cell 2019. This dataset is available through
SeuratData.
bmcite <- InstallData("bmcite")Load the data from SeuratData. Here we also make sure to
normalize the data before running Pan-human Azimuth.
bmcite <- LoadData("bmcite")
bmcite <- NormalizeData(bmcite)
Annotate a dataset with Pan-human Azimuth
Users have two options for running Pan-human Azimuth on their
dataset: cloud-based or local. The cloud-based option is the easiest to
use, and requires no additional setup. The local option requires setting
up a Python environment with panhumanpy
(the Python package for the Pan-human Azimuth neural network) and its
dependencies.
Annotation results, regardless of the method used, are stored in the Seurat object as cell-level metadata, and the embeddings generated by the underlying neural network are stored in a new Seurat reduction.
Option 1: run CloudAzimuth
The CloudAzimuth function runs Pan-human Azimuth cell
type annotation on a Seurat object via a cloud-based API deployed on
AWS.
bmcite_ann <- CloudAzimuth(bmcite)Option 2: run ANNotate
First, set up a local Python environment:
# Create a new conda environment for Pan-human Azimuth
conda create -n pan-human-azimuth python=3.9
# Activate the environment
conda activate pan-human-azimuth
# Install Pan-human Azimuth and its dependencies
# for more installation options, see https://satijalab.org/pan_human_azimuth/python/panhumanpy.html
pip install panhumanpy
Then ask reticulate to use that environment:
library(reticulate)
# Use the local Python environment for Pan-human Azimuth
use_condaenv("pan-human-azimuth", required = TRUE)
Finally, run the ANNotate function to annotate your
dataset. Note that the initial run may take longer, as the model weights
are downloaded and cached locally.
bmcite_ann <- ANNotate(bmcite)Examine model output
Pan-human Azimuth returns predictions in multiple formats, as well as softmax probability scores to estimate model confidence.
For more information on the output, see the reference.
# Inspect cell-level metadata returned by the model
md <- bmcite_ann[[]]
# New metadata columns include final_level_labels, final_level_confidence,
# and full_hierarchical_labels.
colnames(md)
## [1] "orig.ident" "nCount_RNA"
## [3] "nFeature_RNA" "nCount_ADT"
## [5] "nFeature_ADT" "lane"
## [7] "donor" "celltype.l1"
## [9] "celltype.l2" "RNA.weight"
## [11] "full_hierarchical_labels" "final_level_labels"
## [13] "final_level_confidence" "full_consistent_hierarchy"
## [15] "azimuth_broad" "azimuth_medium"
## [17] "azimuth_fine" "azimuth_label"We can view a histogram of softmax probabilities, which reflect the model confidence associated with each cell’s annotation:
ggplot(md, aes(x = final_level_confidence)) +
  geom_histogram(bins = 20, fill = "skyblue") +
  labs(
    x = "Softmax probability",
    y = "Count",
    title = "Histogram of softmax probabilities") +
  theme_bw()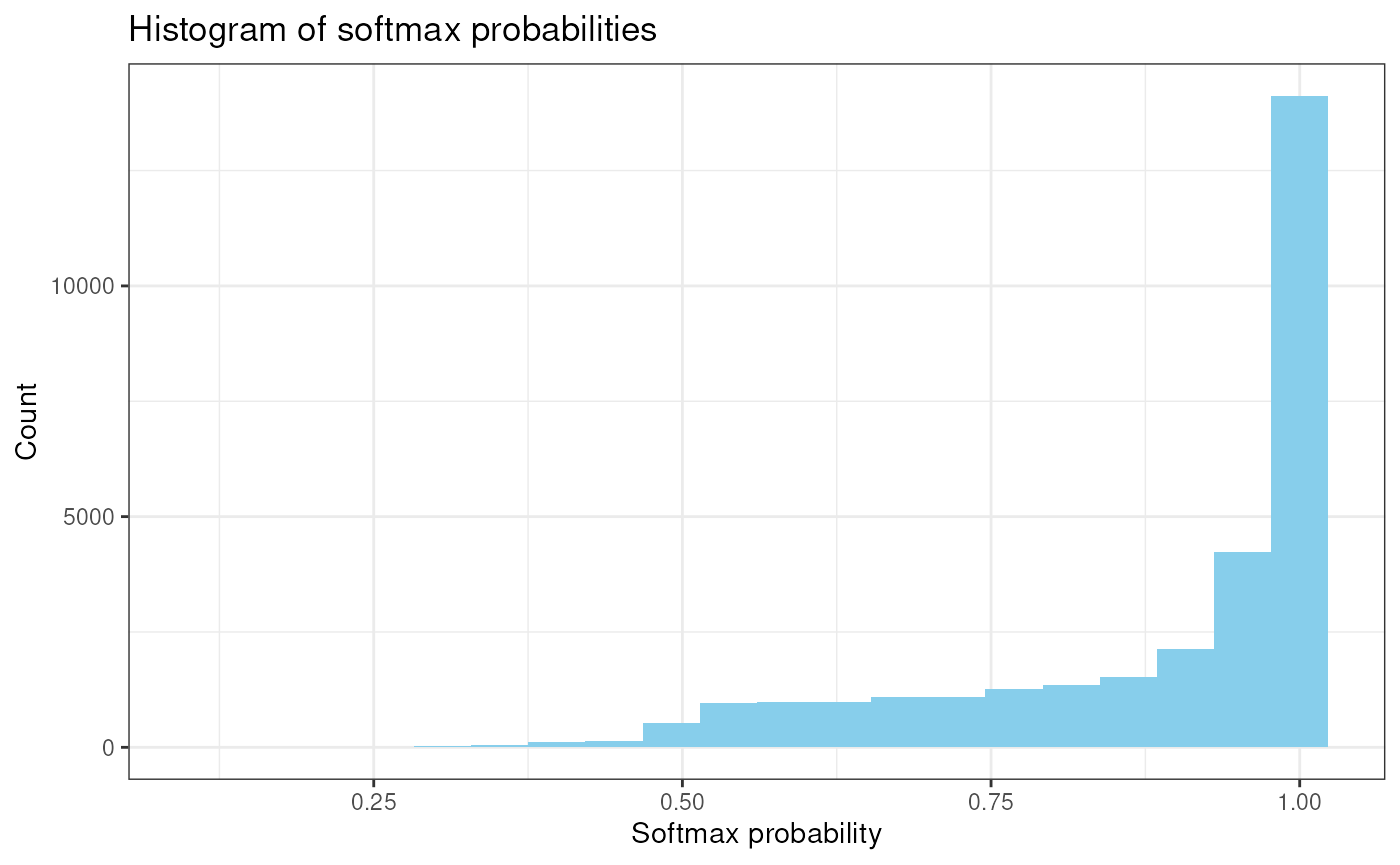
As a QC / filtering step, we can remove cells with low scores:
# remove cells with low scores
bmcite_qc <- subset(bmcite_ann, final_level_confidence > 0.5)
Generate UMAP of Azimuth embeddings
Pan-human Azimuth provides embeddings of the encoding layer generated
by the underlying neural network, stored in the
azimuth_embed 128-dimensional reduction. We can use this to
generate a two-dimensional visualization of the dataset, to examine cell
type predictions in this low-dimensional space.
# Use azimuth_embed as input to generate UMAP
bmcite_qc <- RunUMAP(
  bmcite_qc,
  dims = 1:128,
  reduction = "azimuth_embed",
  reduction.name = "azimuth_umap")
Visualize predictions
The full_hierarchical_label for each cell provides the model’s classification at each level of granularity, with different levels separated by the ‘|’ character.
p2 <- DimPlot(
  bmcite_qc,
  group.by = "full_hierarchical_labels",
  label.size = 1.5,
  label = TRUE,
  reduction = "azimuth_umap",
  repel = TRUE) + NoLegend()
p2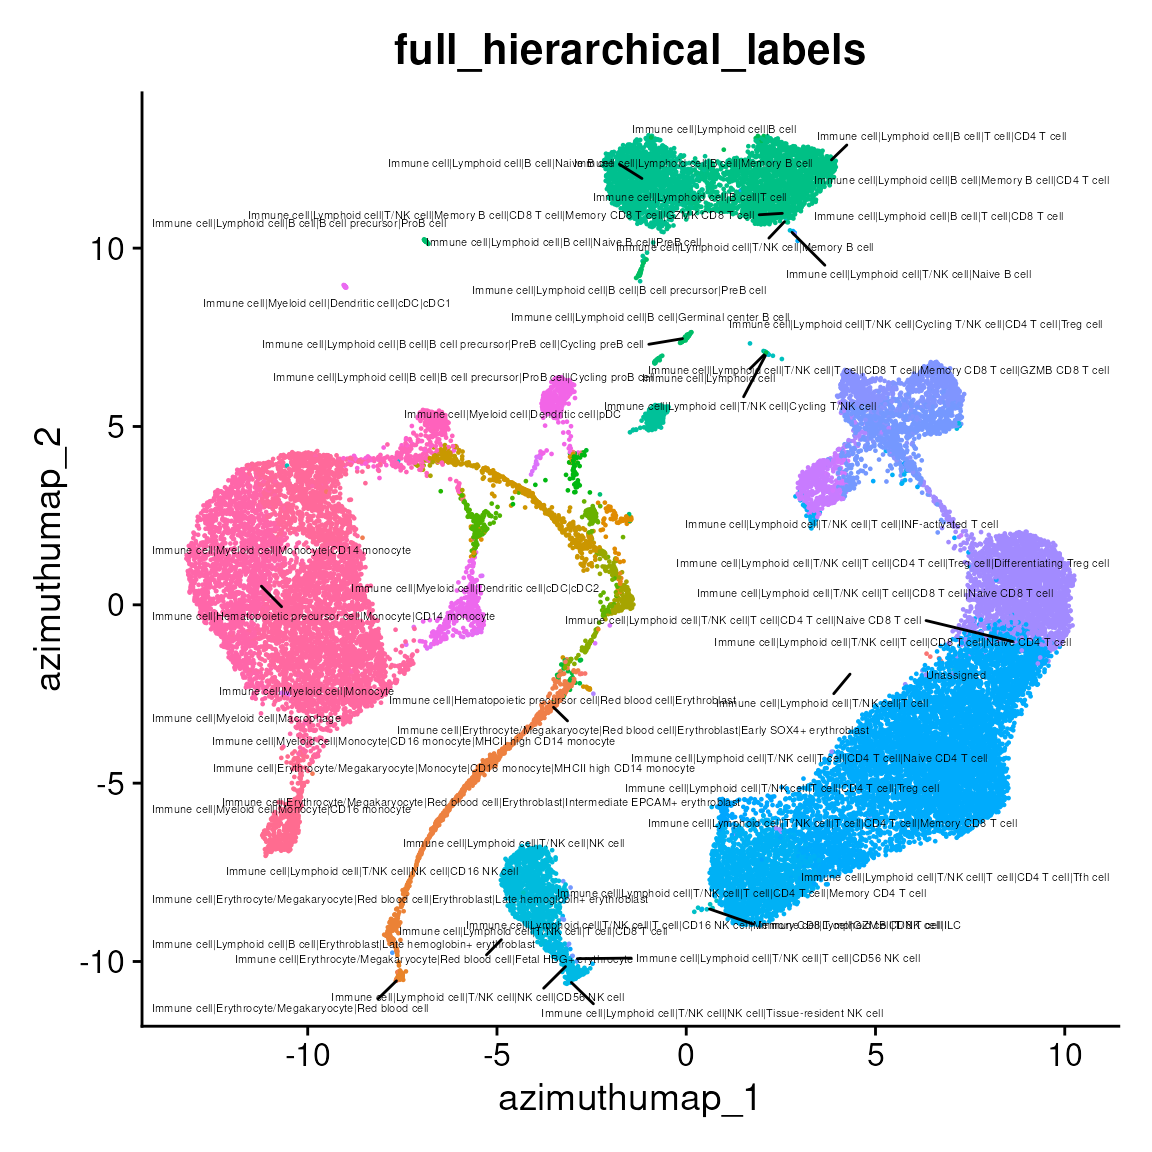
To avoid the long length of the full hierarchical label, we also
output the final level of granularity in a separate column,
final_level_labels, which is the last (most specific) level
of the hierarchy for each cell.
p3 <- DimPlot(
  bmcite_qc,
  group.by = "final_level_labels",
  label.size = 2,
  label = TRUE,
  reduction = "azimuth_umap") + NoLegend()
p3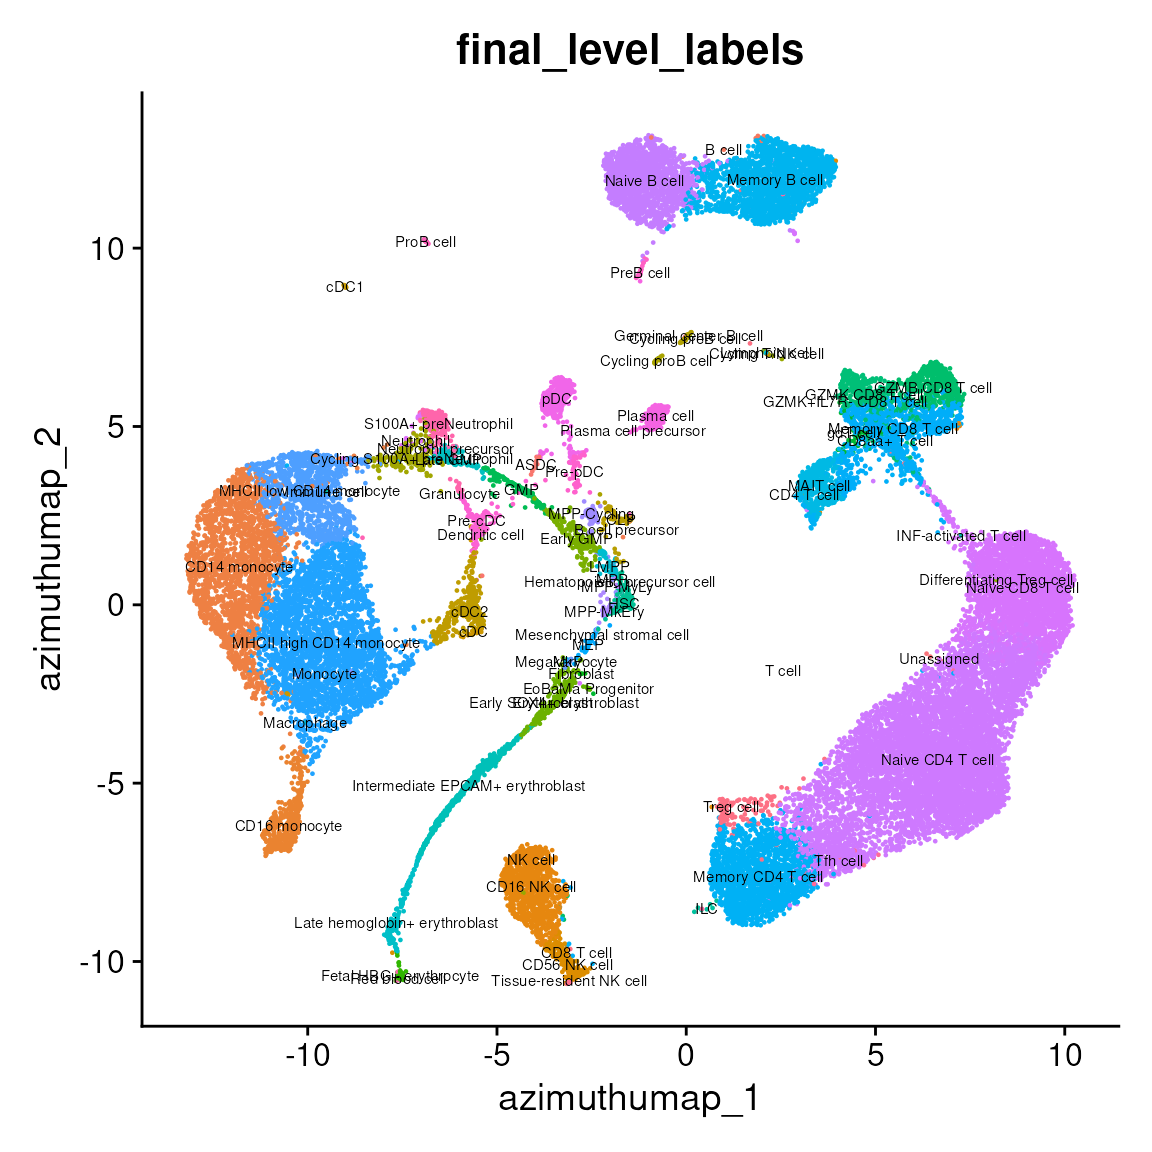
p4 <- FeaturePlot(
  bmcite_qc,
  features = "final_level_confidence",
  reduction = "azimuth_umap")
p4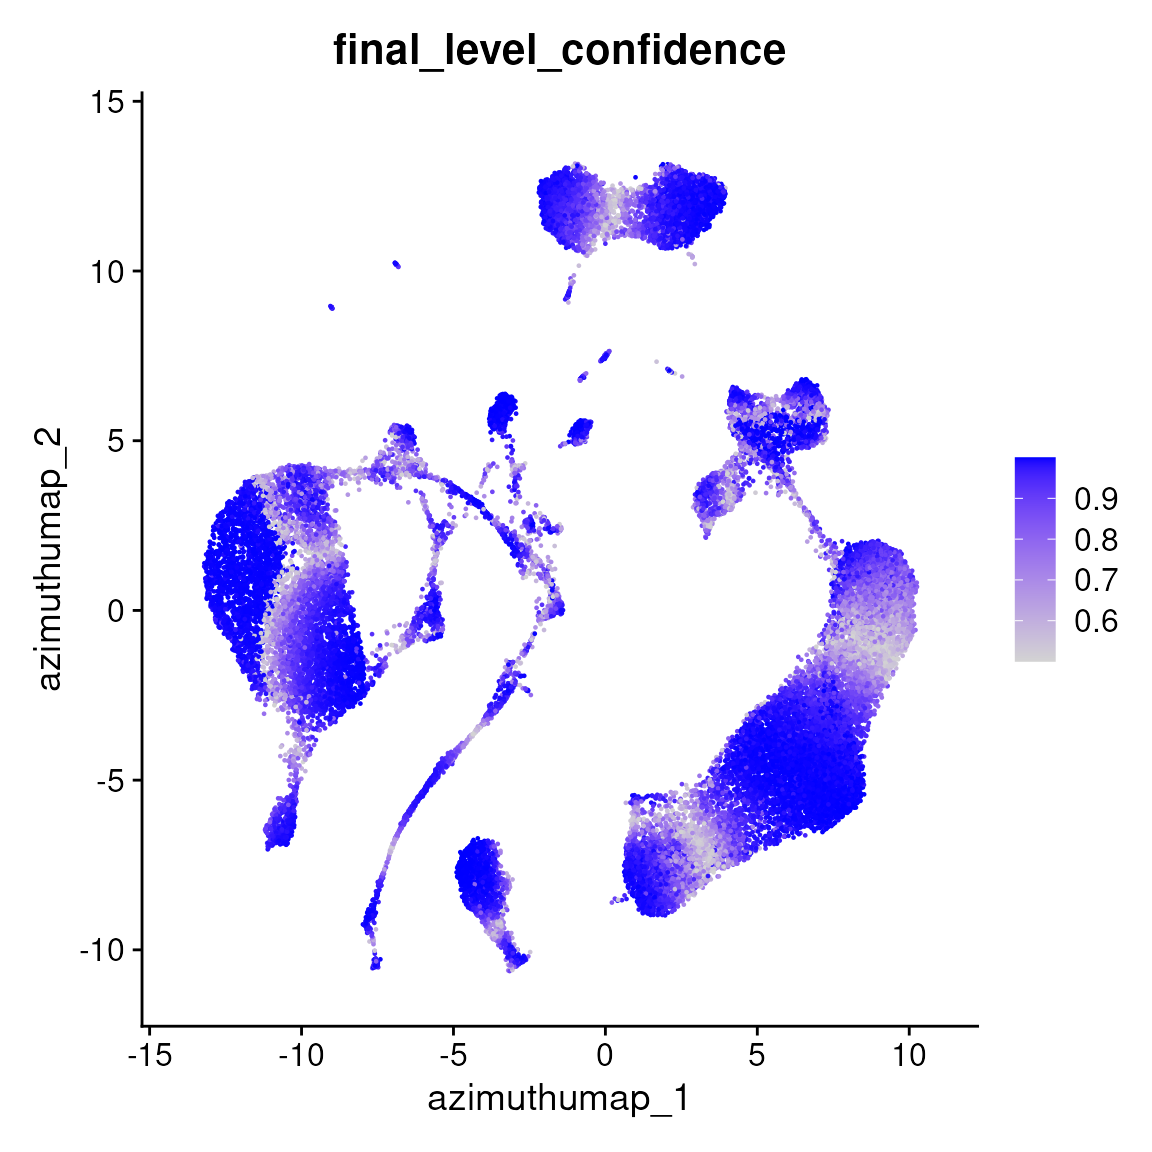
We also postprocess our predictions to provide labels at three
consistent levels of granularity for easy handling, marking any cell
with an invalid full hierarchical label (based on
full_consistent_hierarchy) as False.
-
azimuth_broad: Corresponds to level_zero_labels (e.g. Immune cell) -
azimuth_medium: Medium level of granularity (e.g. T cell) -
azimuth_fine: High level of granularity (e.g. Treg cell)
These categories provide a consistent level of granularity for each
cell, but may differ from the final_level_label, either by
forcing the model to predict further along the cell type hierarchy than
its initial prediction, or by rolling back its prediction to a lower
level of granularity.
p5 <- DimPlot(
  bmcite_qc,
  group.by = "azimuth_medium",
  label.size = 3,
  label = TRUE,
  reduction = "azimuth_umap") + NoLegend()
p5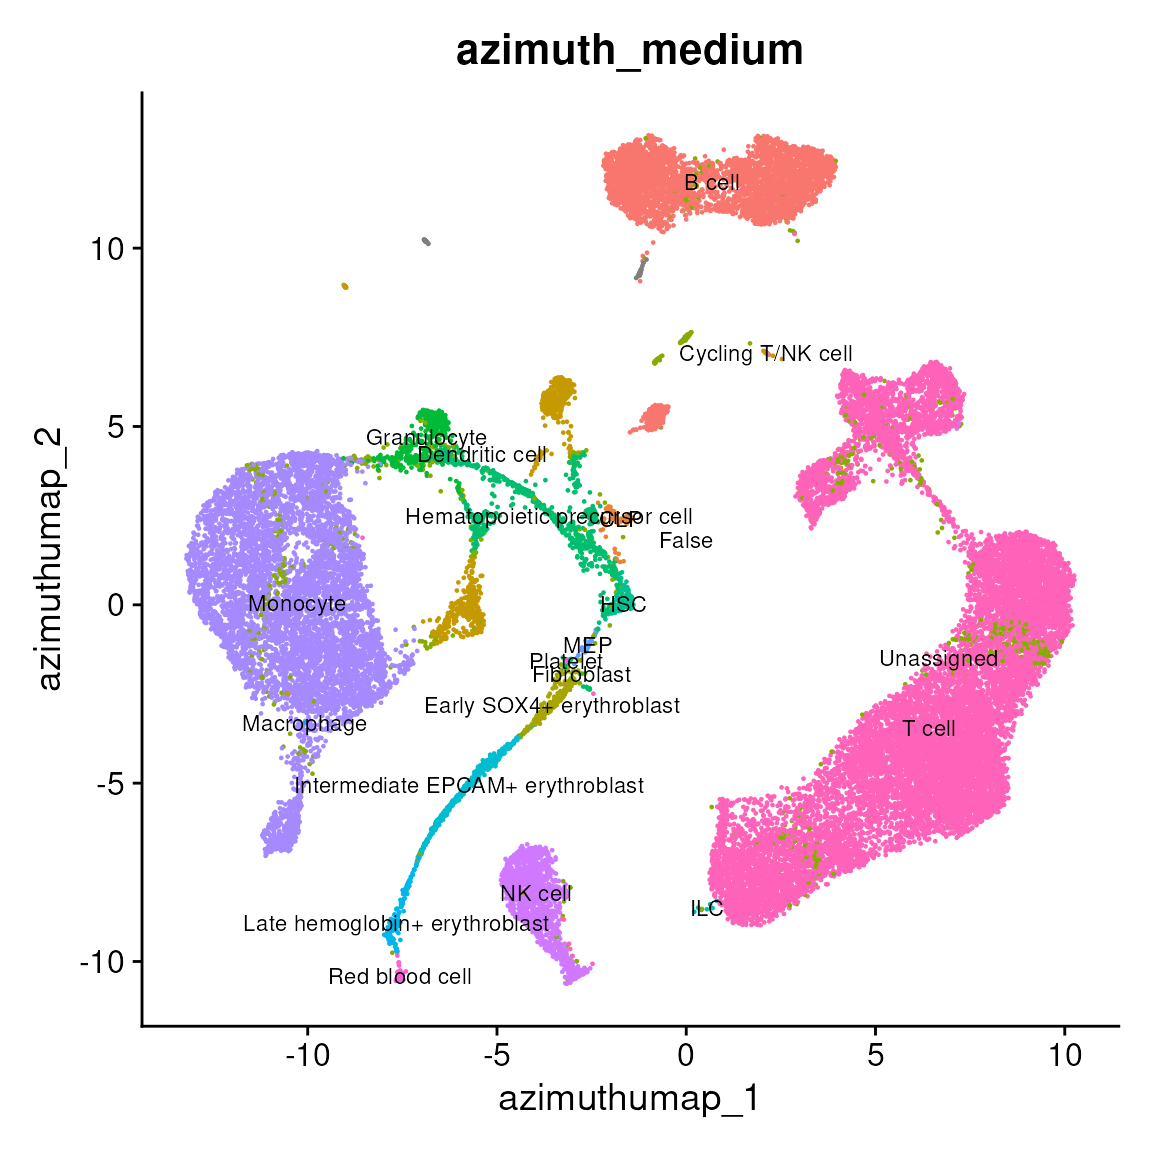
p6 <- DimPlot(
  bmcite_qc,
  group.by = "azimuth_fine",
  label.size = 3,
  label = TRUE,
  reduction = "azimuth_umap") + NoLegend()
p6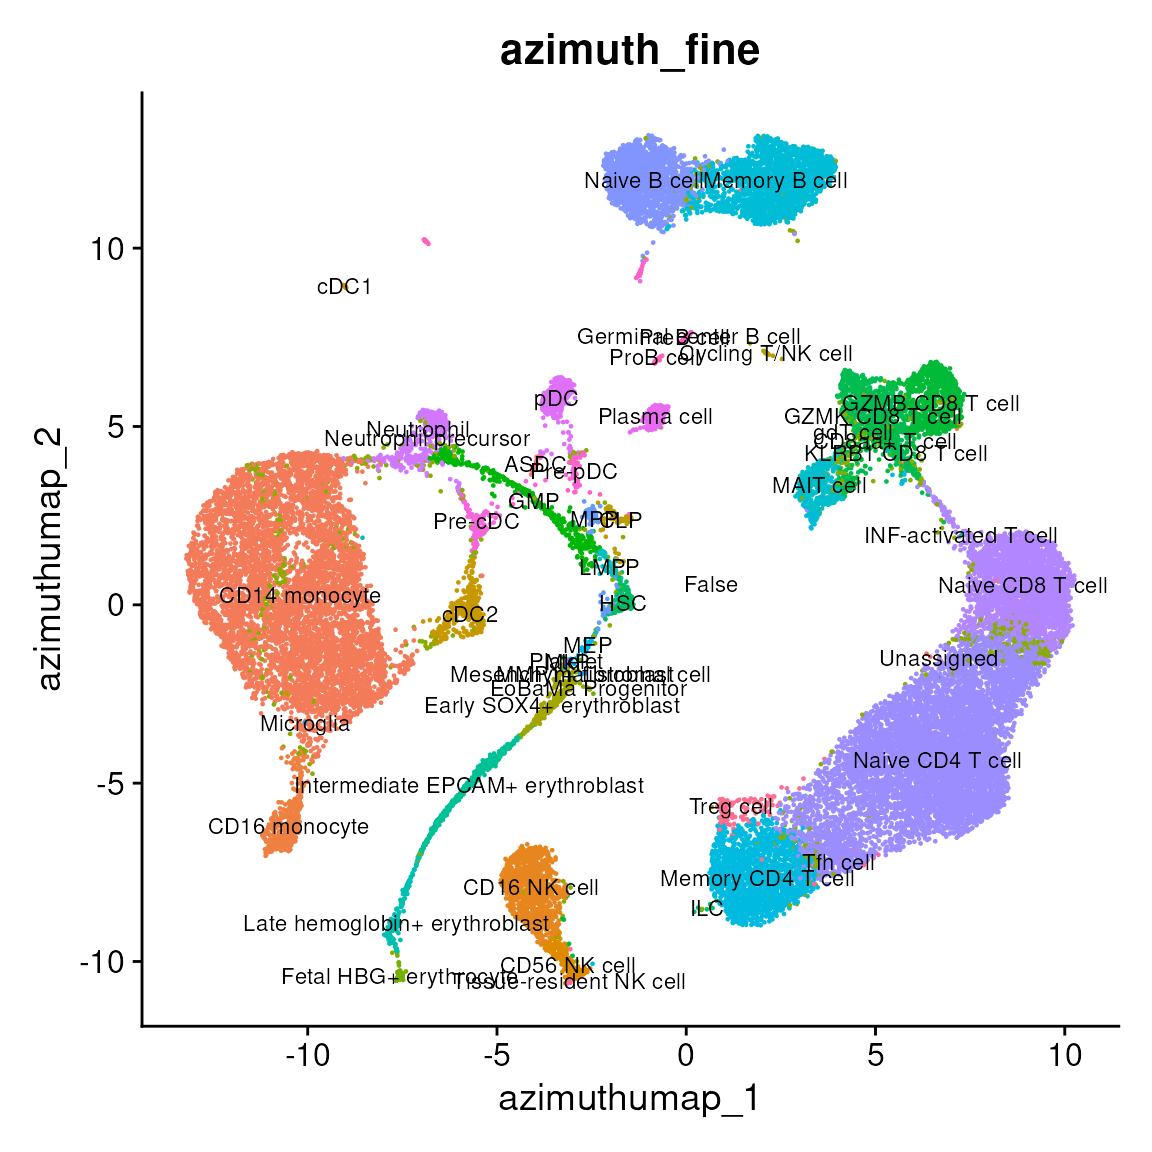
To remove the number of labels displayed, we can filter labels with
less than a certain number of cells using PrepLabel.
Here, we filter labels with less than 20 cells per label. This can be
useful to filter outliers, especially as Pan-human Azimuth does not
perform smoothing of single-cell labels by cluster. Therefore, a single
outlier annotation for one cell will still display the outlier label on
a visualization, and the PrepLabel function can help with
this.
bmcite_qc <- PrepLabel(
  bmcite_qc,
  "azimuth_fine",
  "azimuth_fine_filtered",
  cutoff = 20)
p7 <- DimPlot(
  bmcite_qc,
  group.by = "azimuth_fine_filtered",
  label.size = 3,
  label = TRUE,
  reduction = "azimuth_umap") + NoLegend()
p7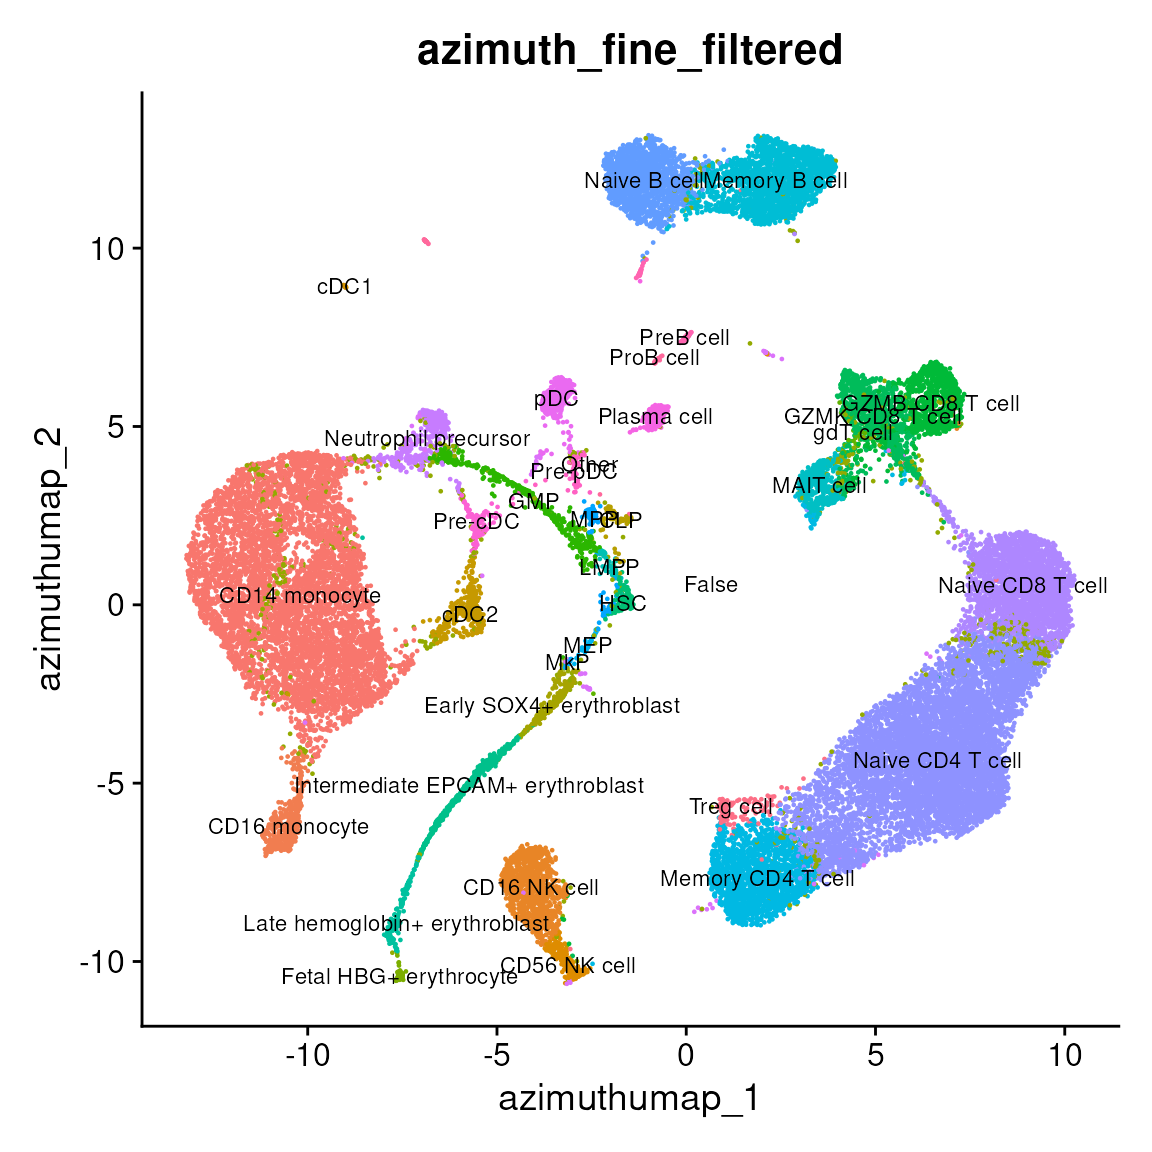
Visualize differentially expressed features
The make_azimuth_QC_heatmaps function allows you to
easily explore the quality of predicted labels by creating expression
heatmaps by predicted cell type, with optional parameters for improved
visualization.
Plots are saved by azimuth_broad categories by default,
with the exception of immune cell types grouped separately by lymphoid
or myeloid/erythroid subpopulations.
plots <- make_azimuth_QC_heatmaps(bmcite_qc)
print(length(plots))
## [1] 3
p8 <- plots[["Immune_Lymphoid cell_1"]]
print(p8)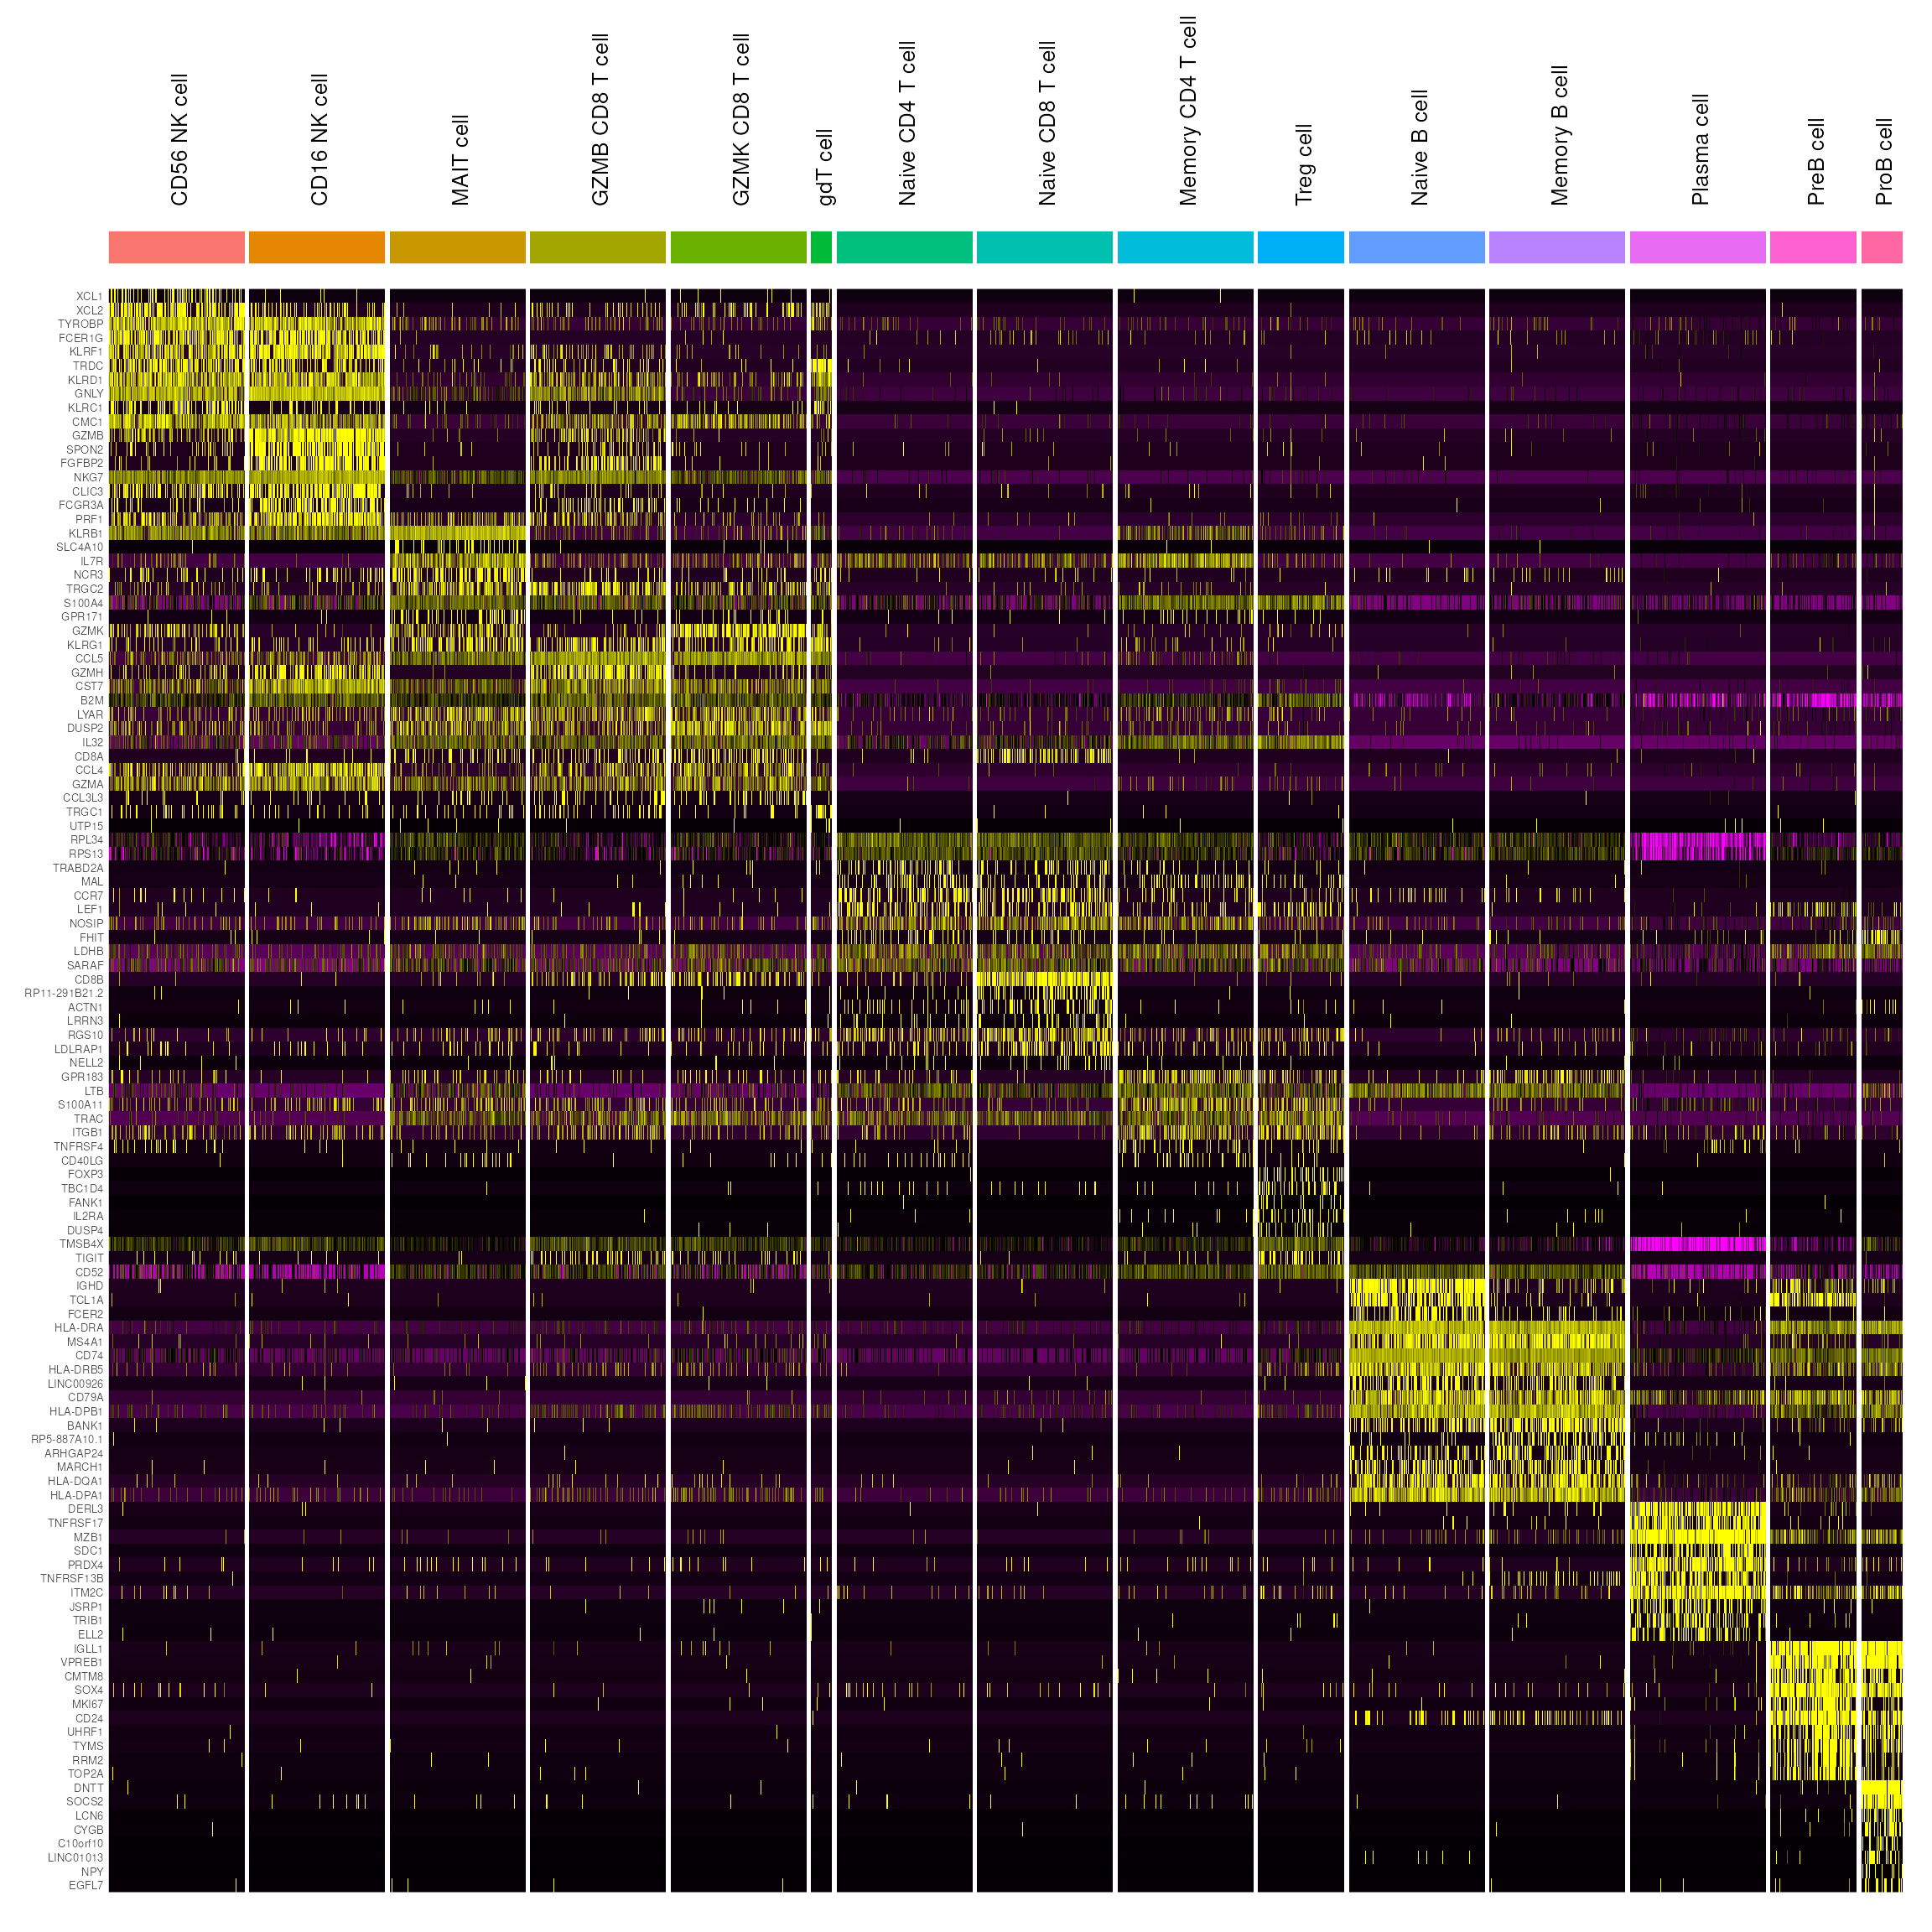
p9 <- plots[["Immune_Myeloid cell_1"]]
print(p9)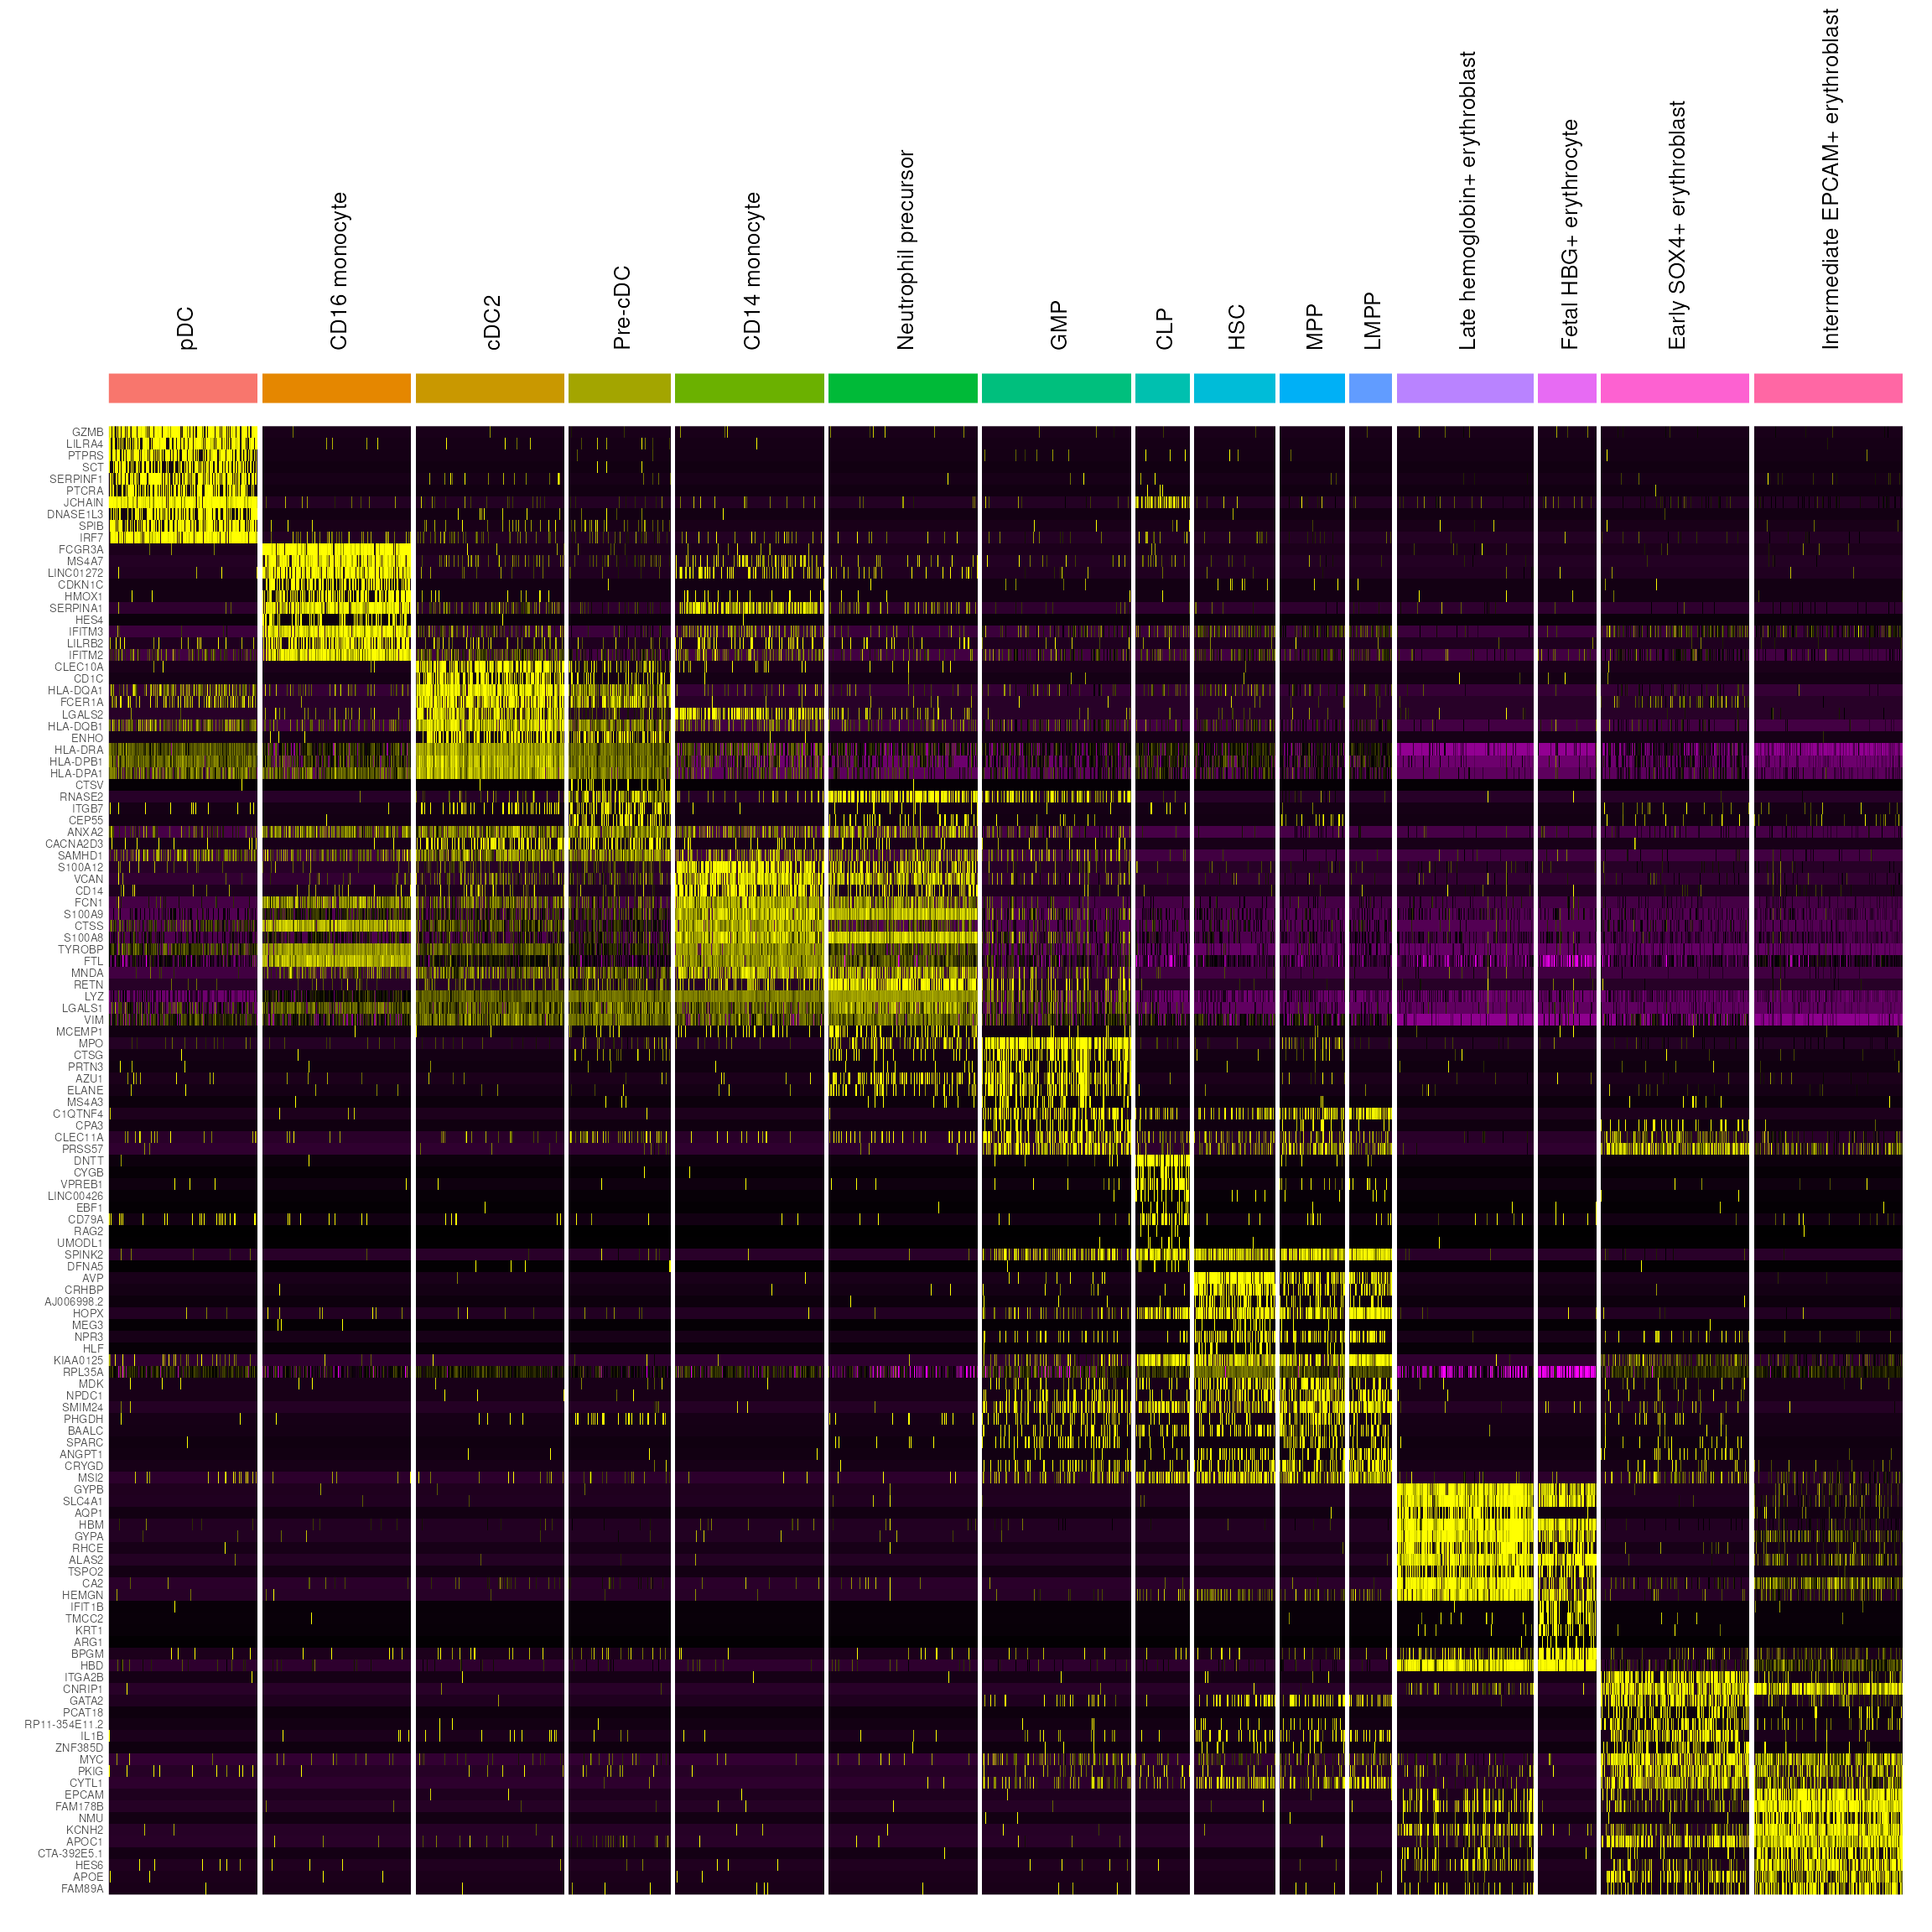
More information
- Read the Pan-human Azimuth paper for the method and evaluation.
- Visit the Pan-human Azimuth website for documentation, tutorials, and resources.
- For detailed options and usage, see the
AzimuthAPIpackage documentation. - For another example of the usage of this package, see the Analysis and visualization of Visium HD data with cell segmentations vignette on the Seurat website.
- For the Python package, see
panhumanpy.
Session Info
sessioninfo::session_info(pkgs = "attached")## ─ Session info ───────────────────────────────────────────────────────────────
## setting value
## version R version 4.5.2 (2025-10-31)
## os Ubuntu 24.04.4 LTS
## system x86_64, linux-gnu
## ui X11
## language en
## collate en_US.UTF-8
## ctype en_US.UTF-8
## tz Etc/UTC
## date 2026-11-06
## pandoc 3.9 @ /usr/bin/ (via rmarkdown)
## quarto 1.8.25 @ /usr/local/bin/quarto
##
## ─ Packages ───────────────────────────────────────────────────────────────────
## package * version date (UTC) lib source
## AzimuthAPI * 1.0.1 2026-11-06 [3] Github (satijalab/AzimuthAPI@f08f243)
## bmcite.SeuratData * 0.3.0 2026-11-06 [3] local
## dplyr * 1.2.0 2026-02-03 [3] RSPM (R 4.5.0)
## ggplot2 * 4.0.3 2026-04-22 [3] CRAN (R 4.5.2)
## hcabm40k.SeuratData * 3.0.0 2026-11-06 [3] local
## ifnb.SeuratData * 3.1.0 2026-11-06 [3] local
## panc8.SeuratData * 3.0.2 2026-11-06 [3] local
## pbmc3k.SeuratData * 3.1.4 2026-11-06 [3] local
## pbmcMultiome.SeuratData * 0.1.4 2026-11-06 [3] local
## pbmcref.SeuratData * 1.0.0 2026-11-06 [3] local
## pbmcsca.SeuratData * 3.0.0 2026-11-06 [3] local
## Seurat * 6.0.0 2026-11-06 [1] local
## SeuratData * 0.2.2.9002 2026-10-05 [3] Github (satijalab/seurat-data@3e51f44)
## SeuratObject * 5.4.0 2026-04-11 [3] RSPM (R 4.5.0)
## sp * 2.2-4 2026-10-11 [3] RSPM (R 4.5.0)
## ssHippo.SeuratData * 3.1.4 2026-11-06 [3] local
## stxBrain.SeuratData * 0.1.2 2026-11-06 [3] local
## thp1.eccite.SeuratData * 3.1.5 2026-11-06 [3] local
##
## [1] /scratch/build-QLRyQPI9/library
## [2] /usr/local/lib/R/custom-lib
## [3] /usr/local/lib/R/site-library
## [4] /usr/local/lib/R/library
## * ── Packages attached to the search path.
##
## ──────────────────────────────────────────────────────────────────────────────