Colors single cells on a dimensional reduction plot according to a 'feature' (i.e. gene expression, PC scores, number of genes detected, etc.)
FeaturePlot(
  object,
  features,
  dims = c(1, 2),
  cells = NULL,
  cols = if (blend) {
     c("lightgrey", "#ff0000", "#00ff00")
 } else {

    c("lightgrey", "blue")
 },
  pt.size = NULL,
  alpha = 1,
  stroke.size = NULL,
  order = FALSE,
  min.cutoff = NA,
  max.cutoff = NA,
  reduction = NULL,
  split.by = NULL,
  keep.scale = "feature",
  shape.by = NULL,
  slot = "data",
  assay = NULL,
  blend = FALSE,
  blend.threshold = 0.5,
  label = FALSE,
  label.size = 4,
  label.color = "black",
  repel = FALSE,
  ncol = NULL,
  coord.fixed = FALSE,
  by.col = TRUE,
  sort.cell = deprecated(),
  interactive = FALSE,
  combine = TRUE,
  raster = NULL,
  raster.dpi = c(512, 512)
)
Arguments
- object
Seurat object
- features
Vector of features to plot. Features can come from:
An
Assayfeature (e.g. a gene name - "MS4A1")A column name from meta.data (e.g. mitochondrial percentage - "percent.mito")
A column name from a
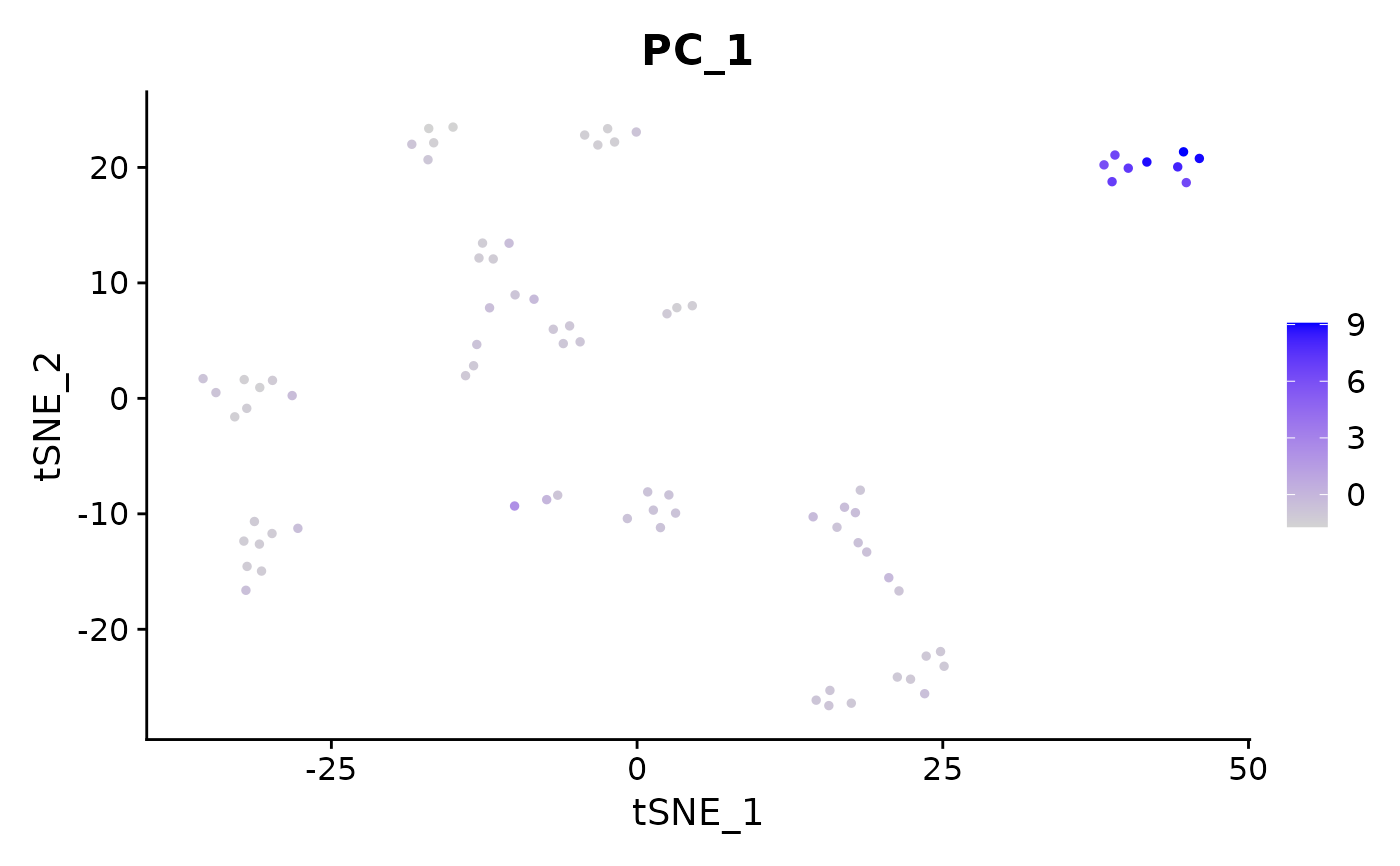
DimReducobject corresponding to the cell embedding values (e.g. the PC 1 scores - "PC_1")
- dims
Dimensions to plot, must be a two-length numeric vector specifying x- and y-dimensions
- cells
Vector of cells to plot (default is all cells)
- cols
The two colors to form the gradient over. Provide as string vector with the first color corresponding to low values, the second to high. Also accepts a Brewer color scale or vector of colors. Note: this will bin the data into number of colors provided. When blend is
TRUE, takes anywhere from 1-3 colors:- 1 color:
Treated as color for double-negatives, will use default colors 2 and 3 for per-feature expression
- 2 colors:
Treated as colors for per-feature expression, will use default color 1 for double-negatives
- 3+ colors:
First color used for double-negatives, colors 2 and 3 used for per-feature expression, all others ignored
- pt.size
Adjust point size for plotting
- alpha
Alpha value for plotting (default is 1)
- stroke.size
Adjust stroke (outline) size of points
- order
Boolean determining whether to plot cells in order of expression. Can be useful if cells expressing given feature are getting buried.
- min.cutoff, max.cutoff
Vector of minimum and maximum cutoff values for each feature, may specify quantile in the form of 'q##' where '##' is the quantile (eg, 'q1', 'q10')
- reduction
Which dimensionality reduction to use. If not specified, first searches for umap, then tsne, then pca
- split.by
A factor in object metadata to split the plot by, pass 'ident' to split by cell identity
- keep.scale
How to handle the color scale across multiple plots. Options are:
“feature” (default; by row/feature scaling): The plots for each individual feature are scaled to the maximum expression of the feature across the conditions provided to
split.by“all” (universal scaling): The plots for all features and conditions are scaled to the maximum expression value for the feature with the highest overall expression
NULL(no scaling): Each individual plot is scaled to the maximum expression value of the feature in the condition provided tosplit.by. Be aware settingNULLwill result in color scales that are not comparable between plots
- shape.by
If NULL, all points are circles (default). You can specify any cell attribute (that can be pulled with FetchData) allowing for both different colors and different shapes on cells. Only applicable if
raster = FALSE.- slot
Which slot to pull expression data from?
- assay
Primary assay to pull feature data from
- blend
Scale and blend expression values to visualize coexpression of two features
- blend.threshold
The color cutoff from weak signal to strong signal; ranges from 0 to 1.
- label
Whether to label the clusters
- label.size
Sets size of labels
- label.color
Sets the color of the label text
- repel
Repel labels
- ncol
Number of columns to combine multiple feature plots to, ignored if
split.byis notNULL- coord.fixed
Plot cartesian coordinates with fixed aspect ratio
- by.col
If splitting by a factor, plot the splits per column with the features as rows; ignored if
blend = TRUE- sort.cell
Redundant with
order. This argument is being deprecated. Please useorderinstead.- interactive
Launch an interactive
FeaturePlot- combine
Combine plots into a single
patchworkedggplot object. IfFALSE, return a list of ggplot objects- raster
Convert points to raster format, default is
NULLwhich automatically rasterizes if plotting more than 100,000 cells- raster.dpi
Pixel resolution for rasterized plots, passed to geom_scattermore(). Default is c(512, 512).
Value
A patchworked ggplot object if
combine = TRUE; otherwise, a list of ggplot objects
Note
For the old do.hover and do.identify functionality, please see
HoverLocator and CellSelector, respectively.
See also
Examples
data("pbmc_small")
FeaturePlot(object = pbmc_small, features = 'PC_1')