Add text labels to a ggplot2 plot
LabelPoints(
  plot,
  points,
  labels = NULL,
  repel = FALSE,
  xnudge = 0.3,
  ynudge = 0.05,
  ...
)
Arguments
- plot
A ggplot2 plot with a GeomPoint layer
- points
A vector of points to label; if
NULL, will use all points in the plot- labels
A vector of labels for the points; if
NULL, will use rownames of the data provided to the plot at the points selected- repel
Use
geom_text_repelto create a nicely-repelled labels; this is slow when a lot of points are being plotted. If usingrepel, setxnudgeandynudgeto 0- xnudge, ynudge
Amount to nudge X and Y coordinates of labels by
- ...
Extra parameters passed to
geom_text
Value
A ggplot object
See also
Examples
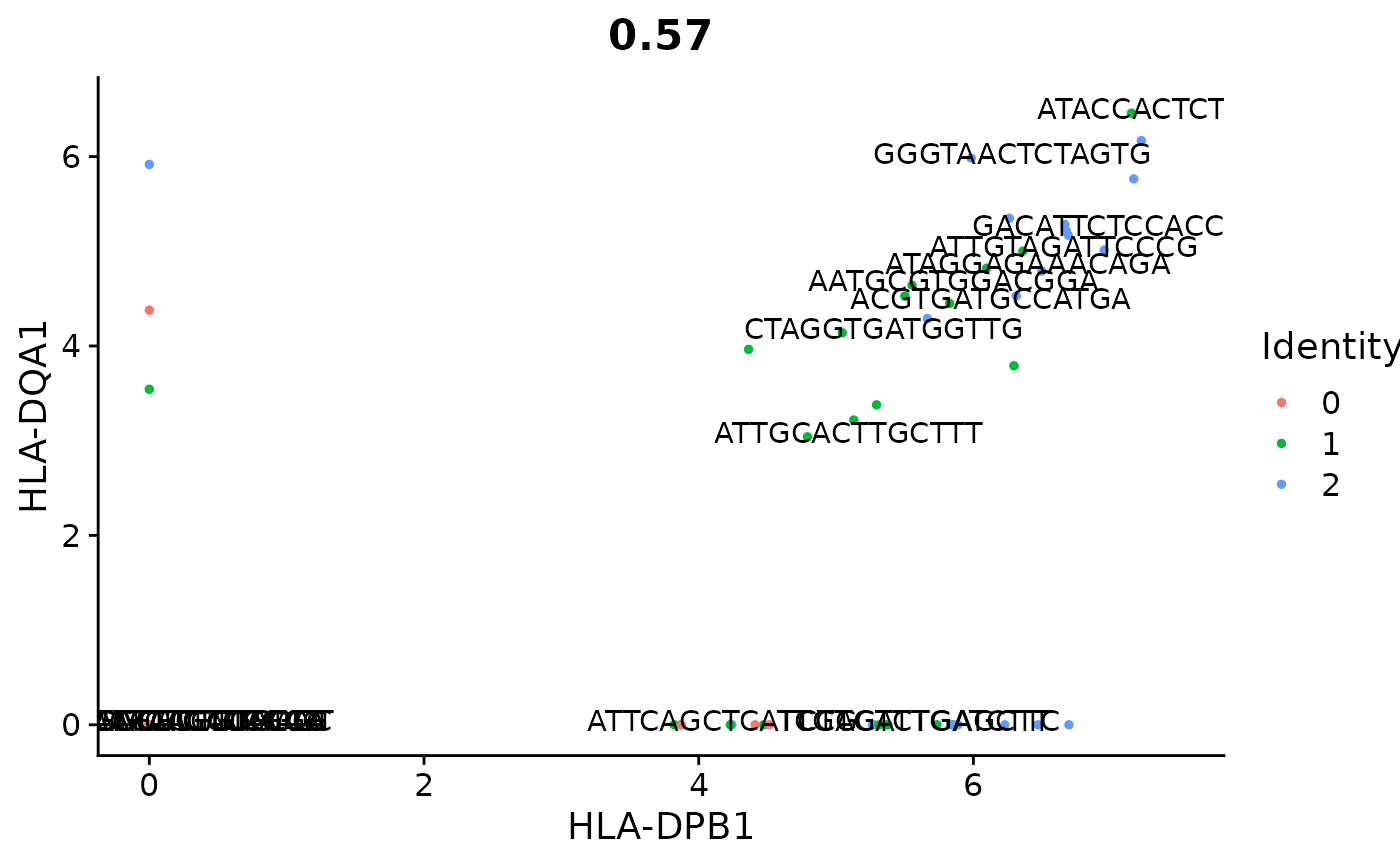
data("pbmc_small")
ff <- TopFeatures(object = pbmc_small[['pca']])
cc <- TopCells(object = pbmc_small[['pca']])
plot <- FeatureScatter(object = pbmc_small, feature1 = ff[1], feature2 = ff[2])
LabelPoints(plot = plot, points = cc)