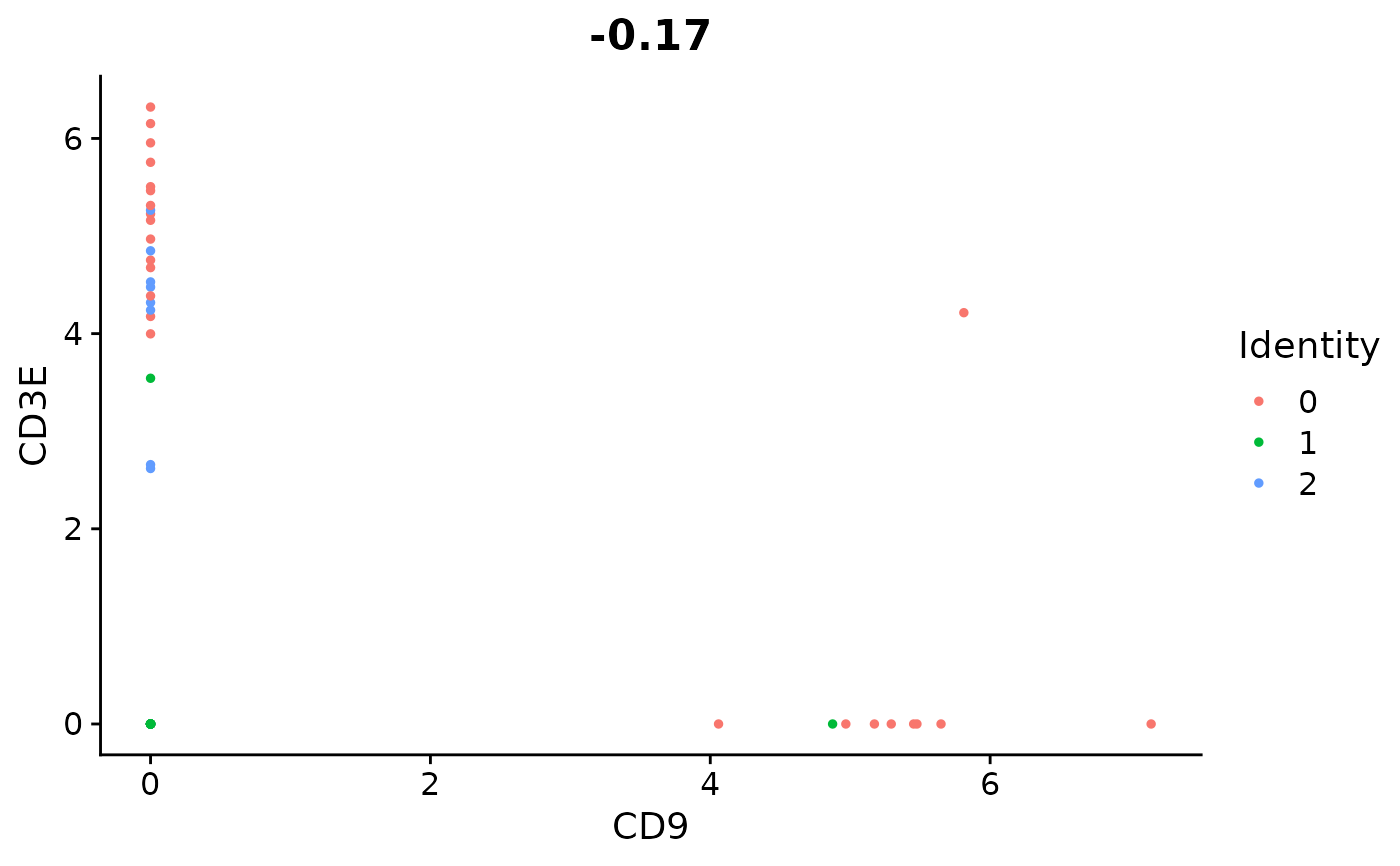
Creates a scatter plot of two features (typically feature expression), across a set of single cells. Cells are colored by their identity class. Pearson correlation between the two features is displayed above the plot.
FeatureScatter(
  object,
  feature1,
  feature2,
  cells = NULL,
  shuffle = FALSE,
  seed = 1,
  group.by = NULL,
  split.by = NULL,
  cols = NULL,
  pt.size = 1,
  shape.by = NULL,
  span = NULL,
  smooth = FALSE,
  combine = TRUE,
  slot = "data",
  plot.cor = TRUE,
  ncol = NULL,
  raster = NULL,
  raster.dpi = c(512, 512),
  jitter = FALSE,
  log = FALSE
)
Arguments
- object
Seurat object
- feature1
First feature to plot. Typically feature expression but can also be metrics, PC scores, etc. - anything that can be retreived with FetchData
- feature2
Second feature to plot.
- cells
Cells to include on the scatter plot.
- shuffle
Whether to randomly shuffle the order of points. This can be useful for crowded plots if points of interest are being buried. (default is FALSE)
- seed
Sets the seed if randomly shuffling the order of points.
- group.by
Name of one or more metadata columns to group (color) cells by (for example, orig.ident); pass 'ident' to group by identity class
- split.by
A factor in object metadata to split the feature plot by, pass 'ident' to split by cell identity
- cols
Colors to use for identity class plotting.
- pt.size
Size of the points on the plot
- shape.by
Ignored for now
- span
Spline span in loess function call, if
NULL, no spline added- smooth
Smooth the graph (similar to smoothScatter)
- combine
Combine plots into a single
patchworked- slot
Slot to pull data from, should be one of 'counts', 'data', or 'scale.data'
- plot.cor
Display correlation in plot title
- ncol
Number of columns if plotting multiple plots
- raster
Convert points to raster format, default is
NULLwhich will automatically use raster if the number of points plotted is greater than 100,000- raster.dpi
Pixel resolution for rasterized plots, passed to geom_scattermore(). Default is c(512, 512).
- jitter
Jitter for easier visualization of crowded points (default is FALSE)
- log
Plot features on the log scale (default is FALSE)
Value
A ggplot object
Examples
data("pbmc_small")
FeatureScatter(object = pbmc_small, feature1 = 'CD9', feature2 = 'CD3E')