Combine ggplot2-based plots into a single plot
CombinePlots(plots, ncol = NULL, legend = NULL, ...)Arguments
Value
A combined plot
Examples
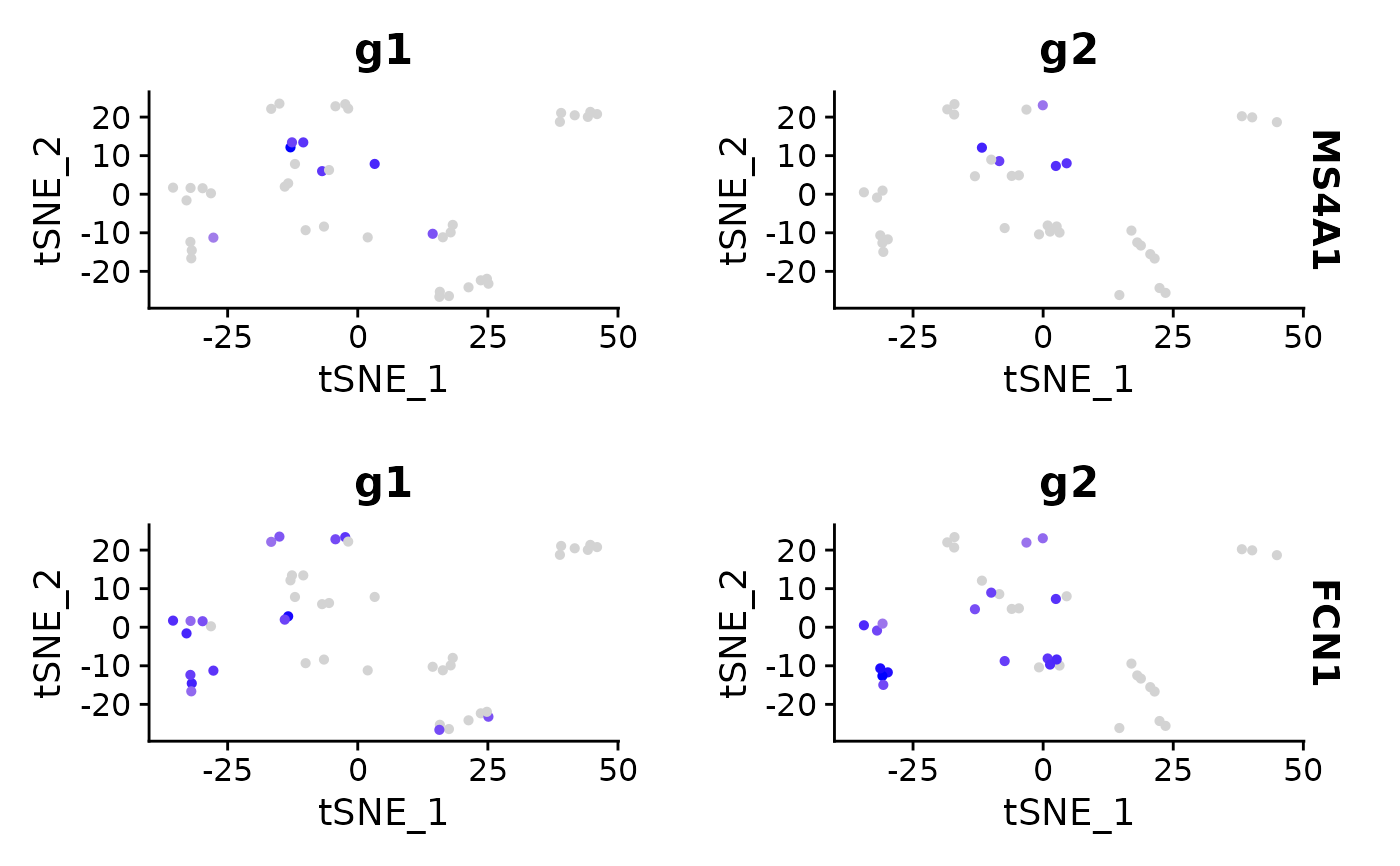
data("pbmc_small")
pbmc_small[['group']] <- sample(
  x = c('g1', 'g2'),
  size = ncol(x = pbmc_small),
  replace = TRUE
)
plot1 <- FeaturePlot(
  object = pbmc_small,
  features = 'MS4A1',
  split.by = 'group'
)
plot2 <- FeaturePlot(
  object = pbmc_small,
  features = 'FCN1',
  split.by = 'group'
)
CombinePlots(
  plots = list(plot1, plot2),
  legend = 'none',
  nrow = length(x = unique(x = pbmc_small[['group', drop = TRUE]]))
)
#> Warning: CombinePlots is being deprecated. Plots should now be combined using the patchwork system.