Plot the Barcode Distribution and Calculated Inflection Points
Source:R/visualization.R
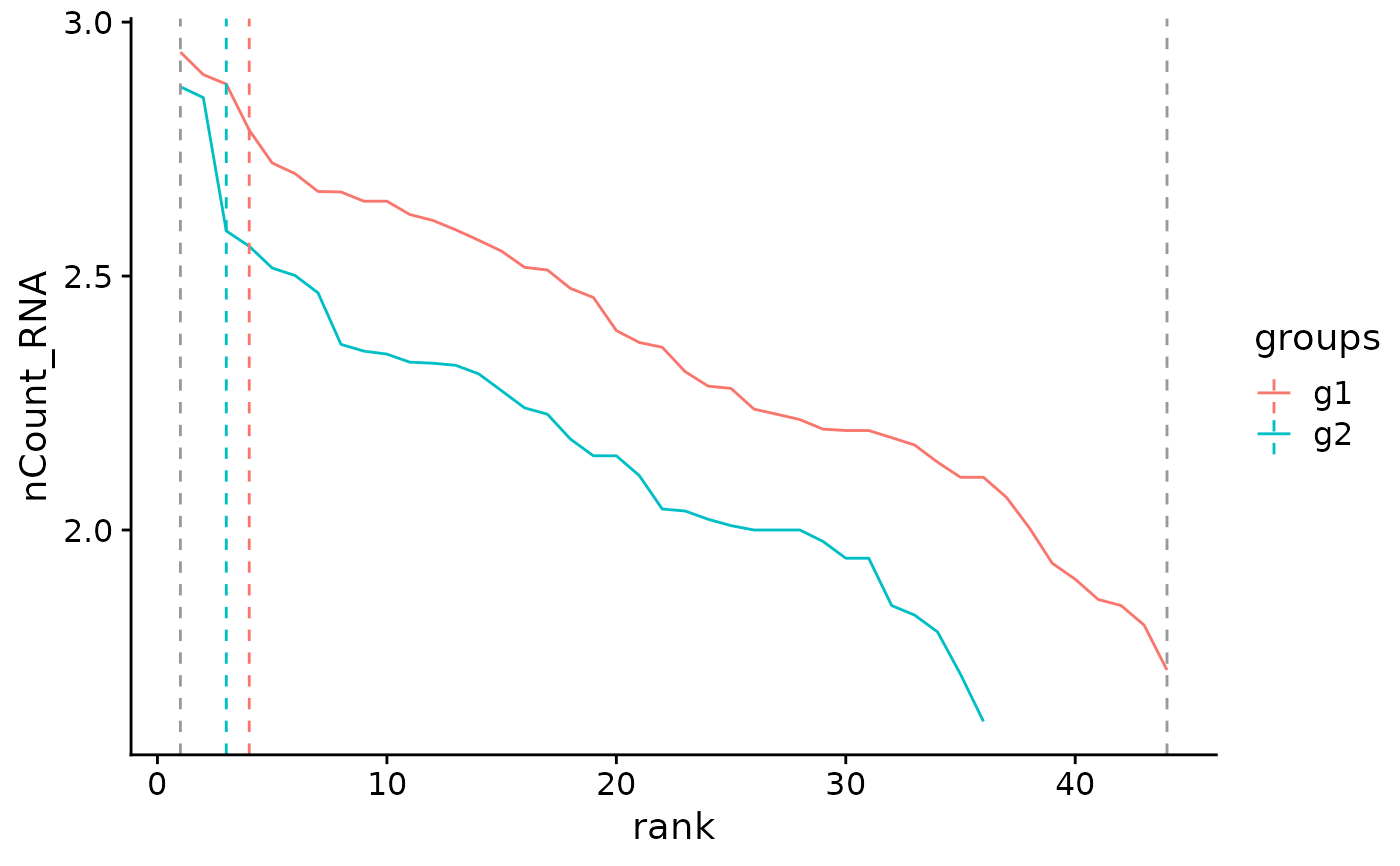
BarcodeInflectionsPlot.RdThis function plots the calculated inflection points derived from the barcode-rank distribution.
BarcodeInflectionsPlot(object)Value
Returns a `ggplot2` object showing the by-group inflection points and provided (or default) rank threshold values in grey.
Details
See [CalculateBarcodeInflections()] to calculate inflection points and [SubsetByBarcodeInflections()] to subsequently subset the Seurat object.
Examples
data("pbmc_small")
pbmc_small <- CalculateBarcodeInflections(pbmc_small, group.column = 'groups')
BarcodeInflectionsPlot(pbmc_small)
#> Warning: Using `size` aesthetic for lines was deprecated in ggplot2 3.4.0.
#> ℹ Please use `linewidth` instead.
#> ℹ The deprecated feature was likely used in the Seurat package.
#>   Please report the issue at <https://github.com/satijalab/seurat/issues>.