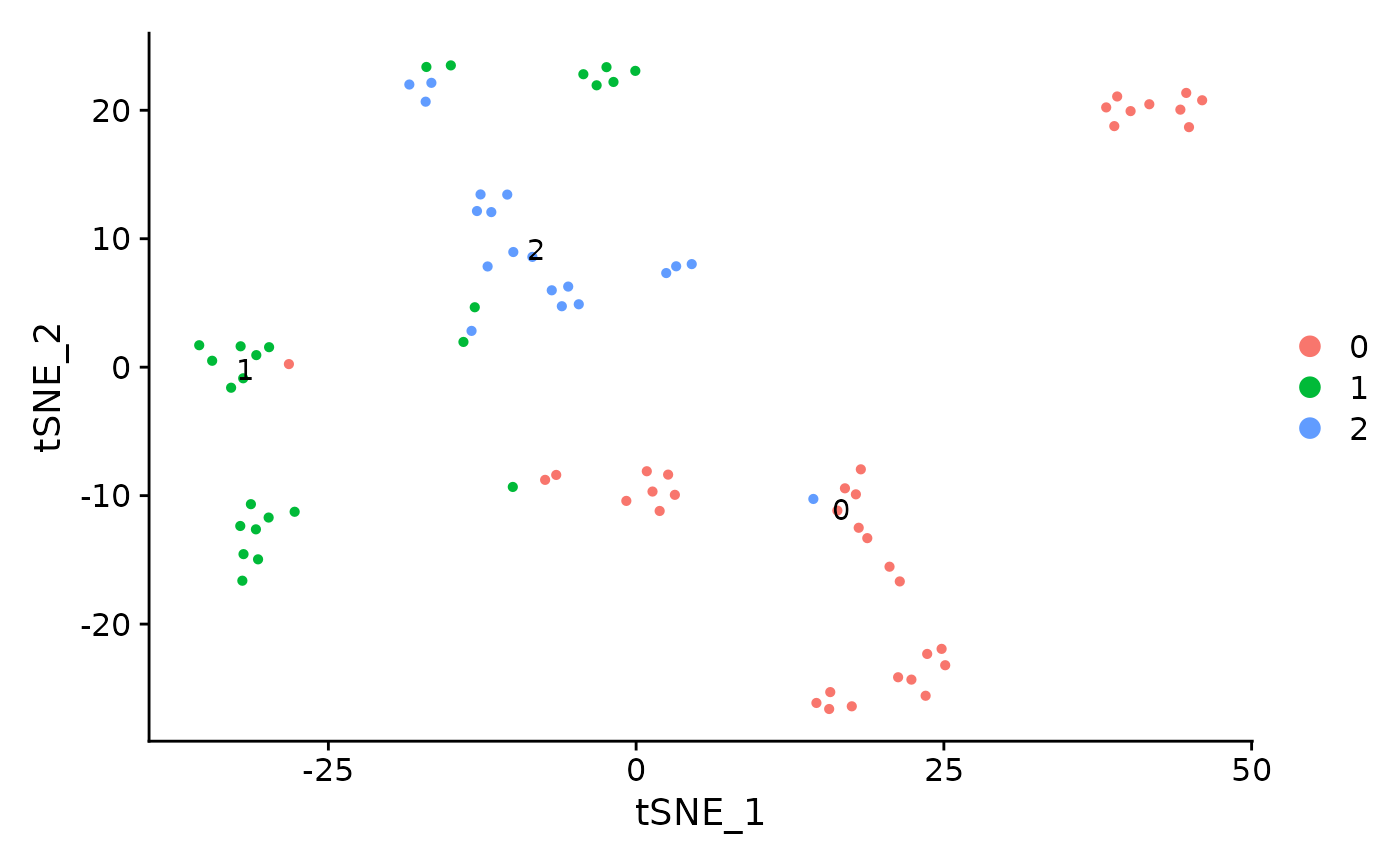
Label clusters on a ggplot2-based scatter plot
LabelClusters(
  plot,
  id,
  clusters = NULL,
  labels = NULL,
  split.by = NULL,
  repel = TRUE,
  box = FALSE,
  geom = "GeomPoint",
  position = "median",
  ...
)
Arguments
- plot
A ggplot2-based scatter plot
- id
Name of variable used for coloring scatter plot
- clusters
Vector of cluster ids to label
- labels
Custom labels for the clusters
- split.by
Split labels by some grouping label, useful when using
facet_wraporfacet_grid- repel
Use
geom_text_repelto create nicely-repelled labels- box
Use geom_label/geom_label_repel (includes a box around the text labels)
- geom
Name of geom to get X/Y aesthetic names for
- position
How to place the label if repel = FALSE. If "median", place the label at the median position. If "nearest" place the label at the position of the nearest data point to the median.
- ...
Extra parameters to
geom_text_repel, such assize
Value
A ggplot2-based scatter plot with cluster labels